This page addresses several aspects of spreadsheet use and the plotting of data in various image-based formats. The in-document links below jump down the page to their section:
The concepts of spreadsheets and of graphing have been around as long
as business accounting practices have been around and as long as teachers
have kept gradebooks on their students. Tables of rows and columns on paper
were used to organize data for record keeping and analysis. As personal
computers came along in the 1970's, it became possible for programmers
to eliminate many tedious and repetitive activities involved in managing
paper spreadsheets. This also greatly improved accuracy. Calculation activities
done by hand were prone to producing many human errors. A pair of graduate
students became bored and frustrated with the tedium of such activities
in their coursework, one from Harvard (Dan Bricklin) and one from MIT (Robert
Frankston). Out of that frustration the first spreadsheet was born in 1978,
Visicalc. The invention of the spreadsheet made personal computers have
real value in the marketplace and legitimated the personal computer industry.
Without the invention of this software category, spreadsheets, the impact
of the personal computer might have been delayed for years. Others have
also developed
a
brief history of spreadsheets.
In addition to the basic spreadsheet activities below, two important other extensions to desktop computing spreadsheets will be introduced as optional extra credit activities, GIS and Google Docs. GIS (Geographic Information Systems)
software extends the concept of columns of data and graphing to themes
and maps and Google Docs extends spreadsheet capacity to collaborative sharing over the Net.
Computers eliminate many basic mathematical errors. They cannot
prevent all errors. Their existence does shift our educational focus from
basic calculator activity to issues of planning, design and judgment. Our
planning though will only be as good as the quality of our data and designs.
As the saying goes, "garbage in , garbage out." Spreadsheets need to be
seen as a strong introductory tool to a
broad range of composition tools for mathematics and other disciplines.
Though many of these mathematical procedures were first designed for calculators,
then desktop software, increasingly they are available as online web-based
tools on the Internet. Spreadsheets and their graphing features are to
mathematical thinking what word processors are to language arts. Within
the North Carolina K-12 technology competencies, spreadsheets
are now formally to be introduced in second grade in North Carolina.
Spreadsheets skills play an important part in the state-wide 8th grade
computer skills competency exam.
The LEAP Model for Problem Solving
Spreadsheets are one of the many tools that are placed at the
Evoke stage of problem processing. Mathematics is both a form of expression
and a language of human expression. To compose mathematically can mean
composing solutions to given or known problems using this language. English
language instruction could also taught in a similar manner, by providing
students with opening paragraphs and then asking them to complete the essay.
However, fluency with mathematics would seem to require increasing an approach
more common to writing instruction. This would require emphasis on fuzzy
problem situations in which the question or problem must be found within
the setting or situation and then the composition completed (mathematically)
once the question is framed.
Selecting Spreadsheets
Selecting spreadsheets involves determining criteria, reading reviews and exploring Web sites that address spreadsheet use.
Criteria for Selection
Beyond cost, there are several basic technical considerations to consider:
Platform compatibility. Will the program run the equipment that
is in the school classroom or computer lab? It may also be useful to have
the program run on different types of computers found in the school district.
Features. Have you personally used the program to test whether it
can do the activities that students need at your grade level? Check the
feature set against the state competencies for your grade level.
Ease of use. Does the program provide an appropriate level of ease
of use for its intended age level? "Feature glut" refers to have far more
features than the user (student) will ever use or need and that these features
are displayed before users are ready to understand or use them. There are
spreadsheets on the market that simplify their screen displays for even
primary level students.
Help. Are there detailed help features built in to the program that
not only explain how different features work, but walk the user through
more complex activities (assistants or wizards)?
Graphing. Can the spreadsheet automatically produce a variety of
charts and graphs? It is also very beneficial to have a "hot" link between
the data and the graph so that any change to the data in the cells is automatically
reflected in the graph.
Reviews of Common Spreadsheets in Use Today
To find reviews, search the Internet using these terms in search fields:
"spreadsheet review" or "spreadsheets reviews" or product based such as "Excel
reviews." Yahoo in particular keeps an
index to spreadsheet reviews. Software houses often keep the more positive
reviews of their spreadsheets on their company web site.
Net Sites Focused on Spreadsheets
Comp.apps.spreadsheets,
a newsgroup for discussion of spreadsheets on various platforms.
The Spreadsheet Page. A site by John
Walkenbach, a popular author of articles and books and shareware developer
of the Power Utility Pak for Excel.
Excel screen movie tutorials by:
Atomic Learning (subscription fee but excellent);
Lynda.com
(subscription fee). Screen movies are highly recommended. They have many
advantages over reading text, in large part because using a computer is graphics
and process based, some that text has a much hard time communicating than a
screen movie.
Software Illustrated MapLand, software
that creates drag-and-drop geopolitical maps right in your Microsoft Excel
spreadsheet.
Live Access to Climate Data.
"The PMEL/TMAP "Live Access to Climate Data" system allows you to brows
and extract data from a large library of gridded climate data. You can
obtain color graphics, spreadsheets, and formatted data files."
Spreadsheet Instruction
Use pre-made spreadsheets to solve problems
Generally, we've had experience with reading before we learn to write. Following the same pattern with spreadsheets is just good instructional technique. The first stage of reading and using completed spreadsheets does not always require changing
anything in the spreadsheet. It merely requires the ability to read the
spreadsheet. However, unlike text on a printed page, a spreadsheet routinely has data that is hidden from the initial view of the columns
and rows of cells in the spreadsheet. For example, a cell may contain just
a number. But a cell may also display a number which is the result of the calculation of a
formula hidden under the displayed data. Merely clicking the cell shows
the calculation in the editing window and the result of the calculation
in the selected cell.
To read the all the formulas at once in a spreadsheet, use the CTRL Tilde key combination, a toggle switch that flips back and forth between the formulas view and the calculations view.
The next section begins the hands-on study of spreadsheets by learning how to navigate around a
new blank spreadsheet, an empty spreadsheet space that forms a grid of
cells in rows and columns. Move among the cells: using the arrow keys;
the page up and down keys; the mouse pointer and the name box towards the
upper left corner of the screen which jumps to any coordinates that you
type in, such as A1, C4, or H24.
When opening a pre-made spreadsheet in the
spreadsheet folder that you will be given, notice what part of the spreadsheet
changes when the cursor selects or moves into cells that contain calculations
(formulas). Several sample spreadsheets will be given in the next section. Spreadsheet cells can contain labels (such as words), values (numbers) and formulas (calculations that always begin with an equal sign
(=)). These formulas may contain both numbers and cell coordinates. The
coordinates for a cell act as variables that provide the numbers for calculations
in an equation. When studying pre-made spreadsheets, throughly explore
the spreadsheet by clicking in its cells to determine where the formulas
are r use CTRL Tilde. Study the formulas to determine what they do. Only with this background
exploration completed should you begin to answer questions related to a given
spreadsheet.
Understanding and Problem Solving with Existing Spreadsheets
Understand/read existing spreadsheets. Use the Sample
Questions and spreadsheets page to find and answer a series of questions that
require the use of a variety of completed spreadsheets.
Using these model questions and the sample spreadsheets, create and put 3 questions on a web page titled Spreadsheet & Database questions. Link that page to
the computers page. The database questions that will be created in the
later chapter on databases can go on the same web page. This work may
be easier to carry out if this sample question page is printed to paper
instead of read from the screen. These spreadsheet questions model
the kind of questions asked during final exams. They are
modeled on the kinds of questions asked on the 8th grade computer literacy
exams that have been given across North Carolina.
Excel for Macintosh and Windows Platforms
Want to know more about Excel? Additional spreadsheet training that supports and complements classroom
instruction is also available. You can select online training
for Microsoft's Excel, but this requires an account username and password.
See also the Help menu command in Excel.
Edit existing spreadsheets.
The second instructional step in learning and teaching spreadsheets is to edit existing ones, to learn how to make changes in them. By changing the correct cells in a spreadsheet, formulas hidden with
the spreadsheet change their calculations. In order to complete the Sample
Questions assignment, you will need to change some data in selected cells of
the spreadsheet or in some cases enter some small formulas in unused cells.
Figuring out which cell to change and in what way is part of the activity
of the sample questions page.
Use the mouse to click within any cell of existing data and a border appears
around the chosen cell.
Move to the edit window and begin typing in changes. You can add, modify, delete or
make other changes and/or additions to the data as needed.
Creating Spreadsheets from Scratch
The third step in your spreadsheet skill development is to create your own
spreadsheets from scratch.
#0. Introduction to Spreadsheets in Kindergarten and Primary Grades
The NC SCS computer literacy competencies indicate that spreadsheet related
activities should begin in kindergarten and first grade, with actual use
of a spreadsheet beginning in second grade. The symbol SS is used to indicate
spreadsheet related activities.
Kindergarten Computer Literacy Competencies
2.3 Identify items by different attributes using manipulatives and/or
software. (SS)
3.1 Group items by different attributes using manipulatives and/or
software. (SS)
Grade 1
3.1 Group items by different attributes using manipulatives and/or software.
(SS)
3.2 Gather, organize, and display data. (SS)
Using technology at home and school
Gathering, organizing, and displaying data
Grade 2
2.6 Use a graphing program to enter data and graph the results. (SS)
3.1 Collect, sort, and organize information to display as a graph or
chart. (SS)
3.2 Interpret data on charts/graphs and make predictions. (SS)
Using technology in the community
Using electronic database to locate information
Building word processing skills
Collecting, sorting, and displaying data
When planning spreadsheet activities for these grades, introduce the concept
with more familiar technologies before moving to the computer. Blocks
and other manipulatives and paper can all be used to carry out the sorting,
organizing and graphing activities that occur in spreadsheets.
Second grade competencies specifically indicate the use of a spreadsheet
or other graphing program. An easy introduction to the use of spreadsheets
for second grades might be the creation of a survey of the number of pets
in the class. For
example, create a quick practice spreadsheet and graph by estimating the
number of classmates with pets: dogs, cats and fish. Enter the title pet
survey on a cell in a spreadsheet. Next, under the title enter the
information in pairs, the type of pet followed by a number. It is not necessary
to total the numbers. There is plenty to cover here without also introducing
addition. Next, highlight all the cells with data and click the chart wizard
symbol and make a bar or column chart of some kind. It is instructive to
also do this same survey using felt squares or play blocks or other manipulatives
for second graders to see the relationship between the more abstract nature
of the computer and other more concrete ways to express this.
What are some other introductory activities that might be used in kindergarten
and first grade?
There are multiple ways to use this spreadsheet design for all content areas. For example, remember those picture puzzles where you slide things around to make the picture come out right? There are many examples on the web. to provide further work with the higher thinking skill of analysis and provide further work with the important ideas in the spreadsheet that you just made, scramble the information after it is completed and save it by a different file name but add the word scrambled, than ask students to drag the information into the correct cells and unscramble the information. That is, when the spreadsheet cursor over a cell edge turns into a hand, the cell's contents can be moved to a new empty cell location simply by dragging and dropping the information. Once taught, this method also provides a useful assessment activity to see if they understand information at a higher level than recall. The structure of information is just as important if not more important than the factoids from which larger concepts are made.
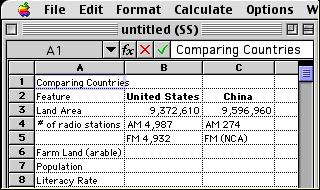
Comparison Spreadsheet
Often activities require that the data is collected from other sources or personal measurement. Preparing for spreadsheet
development means making decisions about organization of labels and text
and a sequence in which a problem should be addressed. To stimulate class
discussion with your students, begin with a dialog about what data would
be needed to solve a problem. Then discuss where one could go to find the
necessary data. As this data is collected, it needs to fit into some pattern
of organization with labels for all numbers and formulas that make the
spreadsheet easy to comprehend.
Complete this assignment. One of the most basic uses of a spreadsheet
is as a table editor. The skills emphasized here are those of writing and
reading a table of information, skills which are also important text literacy
skills. Learning computer technology can create its own anxieties; better
to not add them to math anxiety when first learning spreadsheets. All content areas can and should teach the reading and creation of tables. Along the way the other content areas are helping to establish basic knowledge about the Cartesian coordinate system or plane, an important mathematic concept. This
assignment introduces the navigation and structure of spreadsheets and
data entry without requiring any mathematical calculation, functions or
formulas.
Use such skills to create a comparison spreadsheet of your own
related to your own unit plan project theme(s). A comparison spreadsheet is simply
one in which two or more things are compared, based on a few factors or
subheadings. This requires entering comparison data in rows and columns.
The data for this example exercise for a social studies activity comes from a useful Internet link available
in the CROP site: the CIA Factbook. Find your own source(s) of information
appropriate to the themes established on your unit plan of instruction. Use authentic information and cite your source
in the spreadsheet.
Use a Web browser to view these example Movie Explanations of
the assignment. The videoclips are examples of procedures, not the exact
procedures that need to be followed for this assignment. You of course are welcome to practice by creating a spreadsheet
just like the one in the videoclips. However, the CROP pages continue to
be updated since the videoclips were created. The CIA Factbook link shown in the videoclip is no longer in its prior location but can still be
found elsewhere.
But the important step is to think through how to make your own comparison
spreadsheet, not just copy the example. Use the procedural knowledge of
the above two videoclips to make just such a comparative spreadsheet related
to your curriculum project. Search the web to find your own accurate and current sources
of information. That is, focus on your own topic and create your own spreadsheet
that is related to the theme of your curriculum project. Think of different
columns and rows of information that will stimulate comparisons; type in
actual data. Save this file to your disk in the normal spreadsheet format.
Save this file into your Web folder, not the spreadsheet folder.
Next, prepare your table to be a web page. Current spreadsheets have
a way to automatically turn a spreadsheet into a web page table. Open this
spreadsheet in Excel if you have not already done so and save it to your
disk as an HTML file. Also save this file to your web folder, not your
spreadsheet folder. In later versions of Excel, click File in the menu
bar, find Save As Web Page or Save As HTML file and select it to create
the web page. Now this file can be linked from appropriate places in your
web site. In older versions of Excel, these special commands do not appear
directly under the File menu. Instead, click Save As, and then from the
pulldown marker there for selecting other file formats, select the HTML
or Web format. There will be other spreadsheet applications that can also
save a spreadsheet as a web page.
New, Feb 24, 5 pm. There is a slight complication if you have the latest version of Excel, 2007. In working with a problem web link this afternoon, I discovered that the 2007 version is creating a folder by the same name as the file that also must be uploaded to your web site in order for the link to work. So, if the file is comparison.xls and it is saved as a web page it will become comparison.htm with a folder titled comparison_files. Link to the .htm file but upload both .htm file and the folder.
Link the two versions of this spreadsheet data to your unit plan (bottom
of section VII.) and upload the updated unit plan, and the Excel file and
HTML file versions of the data to your web site. Test your links to make sure that the Excel file version can be downloaded and that the HTML version opens as Web page.
Excel does not produce an web page that shows grid lines for the rows
and columns. Fortunately, there is an easy work around within web page
editors, such as SeaMonkey Composer. Excel builds a table and puts the data
from the spreadsheet into the cells of the table, a simple procedure; but
Excel turns off the command to make lines in the table visible. I don't
know why it defaults to this or whether there is a way to change this default.
It is not always essential to show grid lines. If they are needed
to make the reading of the spreadsheet data acceptable, then use them.
Use Excel to create a spreadsheet and then a web page. If gridlines
are needed, have Composer open the web page version of the file, then follow
these steps:
Click the screen cursor so that it is blinking somewhere inside one of
the cells of the table that appears.
Click Format in the menu bar and select Table Info (this command
will vary slightly across platforms and versions).
Make sure that the Table tab is the active tab.
Look for a place to put a checkmark for Border Line Width and/or a place
to set the width of the line from 0 to 1 or greater. The lines should now
be visible for every cell that has data. If the cell is empty, no lines
will appear. To preserve the appearance of a grid put a period or some
other character in empty cells. Close this dialog box and solid lines will
appear in the place of dotted lines.
Upload and test the web page. If lines do not appear, go back to Table
Info and check the settings to see if the changes were properly made.
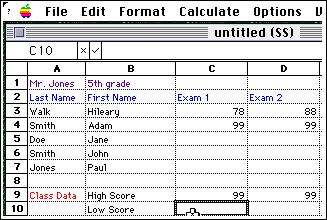
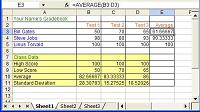
#2. Building a Gradebook Spreadsheet.
Complete this assignment. Create a gradebook spreadsheet. In this
sample spreadsheet gradebook, average a set of 3 student exam grades
for 3 or 4 students. Next, use other functions to carry out some Class Data statistical
analysis on the exam scores. That is, for each of the three exams,
find its highest score (max), lowest score (min), count (count), average (average) and standard deviation (stdev).
You will use the copy formula procedure many times to carry this out. If
this is a gradebook that you are using with existing students, you will
need to change the names of students to something other than their real
names such as storybook characters. Note the symbols for basic mathematical operations: muliplication or times (*, the asterik symbol found above the number 8 key on the keyboard); division (/, the forward slash symbol, generally found on the question mark key), subtraction or minus (-, the hyphen symbol, often found near the equal sign key); and the addition or plus sign symbol (+, generally found above the equal sign key). This work provides the basis for further
reflection. Save this spreadsheet to your spreadsheet foler.
Use the formula examples in the previously provided spreadsheets if a review of how to enter formulas is needed. If using Excel, see also a seven minute screen movie of how to build an Excel gradebook using the latest version (length 7:35 m/s).
The spreadsheet should look something like the screen shot to your left.
It is not a requirement to use color, but note how color can be used to make
the spreadsheet more readable. To complete this spreadsheet, in the appropriate places you will
need to use these functions: average, min, max, stdev, count.
See a full sized finished example as to how
this might look. (But use your own names and different grade data!)
How does univariate, bivariate and multivariate analysis apply to spreadsheets?
Analyzing a single column or range of data is a form of univariate analysis.
Some of the more common questions you can ask about this range of data
include: the range (lowest number to highest number); mean; median; and
mode. If analyzing one column is univariate analysis, then what do bivariate
and multivariate mean?
Once you have worked through this example, think of how this spreadsheet
should be modified to better fit the evaluation required for your curriculum
project. Not all evaluation is numerical, for example a column might include
a letter, word or phrase. Sometimes an evaluation would include both. Modify
the spreadsheet to fit your professional needs, but continue to keep the
class data analysis part on each evaluation that uses numerical values.
Save the file in its standard Excel format.
Next, prepare your modified gradebook to be linked to a web page. Upload it to the file cabinet. Link this file to your unit plan (section
IX.). Test your links.
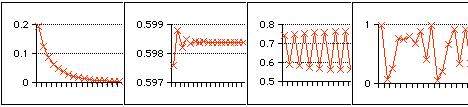
#3. Build a Nonlinear Complexity-scope Graph:
Using May's logistics equation (using Absolute and Relative spreadsheet
values)
Complete this assignment.
Recreate May's logistics model in a spreadsheet. To complete this assignment,
follow this tutorial on the May's equation
which will walk you through the process step-by-step. In class you might
see or ask for a presentation of May's logistic's equation. If time does
not allow a class demonstration, you will use this tutorial to study and
complete this model of system behavior on your own. This exercise is also
a review of the use of absolute and relativevalues
and the use of graphs within spreadsheets. Further, it is an excellent
example of the use of computers for exploratory data analysis and
scientific
visualization. In creating this spreadsheet model you are also preparing
yourself to reflect on some of the most stunning achievements in scientific
thinking of the 20th century. Does this new line of thinking challenge
any assumptions we make as educators? Save this spreadsheet to your spreadsheet folder.
GIS (Geographic Information Systems)
Online
Google Earth is a program that displays maps of the surface of planet Earth. It requires that a client application be installed on a Mac or Win computer, but the mapping images and database of information that is applied to the map in a number of optional layers comes from online sources. It includes a measuring tool for straight-line distances between any two points on its map. The Google Earth Tutorial explores the application's basic features.
Desktop
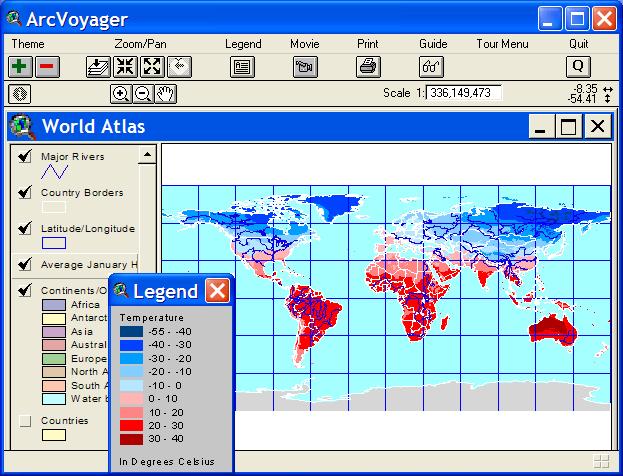
One of the best examples of this kind of application is provided by
the free GIS system from ESRI for educators. This superlative K-12 tool
is called ArcVoyager. When downloaded from the ESRI site, it comes
with a number of datasets and images. The education page at their web site
also provides a number of fine examples of student activities that will
introduce students at different grade levels to the higher order thinking
of GIS activity.
The mapping department of our campus library makes heavy use of this
resource. If you have any mapping questions, need some coaching on the
use of ArcVoyager, have interest in developing maps for some aspect of
your teaching using even more sophisticated computer mapping tools, or wish
to learn more advanced GIS tools, then please visit the map mezzanine of Hunter
Library. Consult with the Head of the Map Department. Do not
be confused by a second free GIS program called ArcExplorer. It does not
come with any of the K-12 maps and data sets nor the Guide that directs
initial learning activities. That said, ArcExplorer is a fine program with
most features in common with ArcExplorer, but learn to use ArcVoyager first.
The download link is also provided in the left column frame of this
chapter. Using what you learn from the classroom presentation, download
this program and explore its features for your professional use.
Download
ArcVoyager Special Edition installer for Windows or Mac (37 MB) Once
it is installed, find it in your list of programs and start up ArcVoyager
and it will simultaneously start up ArcVoyager Guide. Though it is highly
recommended that this be installed on your own computer, this program is already
installed on computers in K268 and can also be downloaded and installed on the
computers in other public labs where it is not present. When these public lab
computer workstations restart, this installation will be lost and must then be
reinstalled to work on it again another day. It can also be downloaded and the
installation program put on a storage device large enough to hold its 37
megabytes of data such as ZIP disks, CDs and USB drives. Given its large file
size, it is strongly suggested that a computer with high speed Internet access
be used to download the program. Next, copy this install program to a USB drive
or burn to a CD to take the program home and install there instead of attempting
to download this from a dial-up modem. To speed installation when home, first
copy the install icon to your own computer and double click the icon to Unzip
the application. A folder of files then be made available. Look for the file
titled SETUP.exe and double click. This will walk through the the setup screens
of the install process.
Use the directions in ArcVoyager Guide.
The ArcVoyager Guide is a separate window that opens next to the actual GIS
window. This Guide provides tutorial information. For now, skip over the section on "Exploring Key Concepts:
Teach Me" and begin with "Viewing World Snapshots: Show Me." Note
the right arrow symbol inside the red circle. Click this right arrow symbol
to move through the instructional pages. Click the links on these instructional
pages. Scroll down each page to complete it.
For this chapter, just complete
the reading and exploring of ArcVoyager Guide's three pages that teach
the use of World Atlas.
Your assignment is to explore the different map views provided in the ArcVoyager
Guide and then print out one of the map views in the World Atlas and
bring it to class. It might look something like this example. Click
within the "thumbnail" example picture below to see the full size.
To do this: When this program opens the
help Guide also opens. Slide this Guide to one side. It opens to its table of
Contents page.
1.In
this Guide section, click the link text shown here in quotation marks. “Viewing World Snapshots: Show
Me This section is a world atlas displaying maps on
nearly twenty different topics. The Atlas gets you using a limited number of
standard ArcView tools as well as a few special ones.”
2.On the ShowMe page, click
“How to Use the Atlas “
3. At the top of the Show Me
How to Use the Atlas screen, click this link.
“Click magnifying glass to
open project” then follow the directions for adjusting and changing maps. Pick
any variation of what is possible there and Print it following the directions
there on how to print.
Of course, unless you have a color printer, the printout will only show
black and white. Color printing is provided to students at cost as long
as an email message is sent to the Print Shop (located above the women's
soccer field) indicating that you did intend to print the image and will
come pay to pay the fifty cents (half page or less) to a dollar (full page)
for the color print. The image that is printed out does not have to be
related to the theme of your unit plan. However, do be thinking of how
this map composing tool might be useful to the development of instructional
materials for your unit plan. In the Windows operating system, this example
was captured using CTRL Printscreen, pasted into the application called
Paint, saved scaled to 25 percent and 100 percent and saved as a jpeg format
files, then linked to this web page. This use of the image capture skills
(e.g., Printscreen key and the application Paint on Windows) will be covered
in more detail in the chapter on image composition and desktop publishing.
Visualizing Data with Robots and Graphing Calculators
There are a number of different approaches to understanding patterns in mathematical data that sometimes fall under the label of scientific visualization. Several approaches will be considered here, robotics and sensors, creating 3D graphs (in Excel and desktop and online applications) and creating maps, a two or three
dimensional field on which locations and other data can be organized. One class of mapping applications is called a Geographic Information System or GIS. It
represents a kind of halfway point between spreadsheets and databases,
or it could be seen as combining the charting capacity of the spreadsheet
with the searchability of a database. All of these approaches intend to increase the motivation, engagement and relevance of the mathematical activity in which students are involved.
Robot Algebra
The Robot Algebra Project is one component of a much larger STEM Curriculum Continuum (STEM-C2) Project. This project is part of the combined effort of Carnegie Mellon (CM), the University of Pittsburgh’s Learning Research and Development Center (LRDC), and a consortium of industry, government, foundation and education partners. The algebra occurs within the programming language that drives robotic activity. The actions of the robot based on variable data collected by the robots sensors serves as the visualization of the success or need to change the underlying mathematics. Important precourses to algebraic understanding, including fractions, ratios and proportions are also addressed in this curriculum. This project uses the Lego Robotics kits in use by STEM participants of this course along with other types of robot kits.
3D Graphing Calculators
3D graphing applications and resources can readily be found in desktop and online formats. Of course the mathematics and the 3D graphing designs are the same, the differences that standout are easy of use, quality of the graphics, and the capacity for animating (rotating) the graph. Adding real world data that address the relevance of the learning along with the highly visual nature of graphing calculators adds considerably to the motivation and engagement of students learning algebra (Holliday & Duf, 2004).
Online
The Online 3D Function Grapher produces excellent results. Clicking the green arrows shows that the rotation is not an automatic, requiring a click for each shift. An animated movie could be made with a screen movie program like ScreenToaster, but would require numerous clicks. Note that the Web page HTML code that can be copied for any equation and as demonstrated by the links in the examples in the bottom of the page. This means a link can be put on a Web page that will open to any graphing equation. That is, the link will send the data to the application, which will instantly plot and display it.
Desktop
Macintosh
On Mac computers, an excellent but not widely known graphing application called Grapher ships free with the computer. Open it by clicking the hard drive symbol, then the Application folder, then the Utilities folder, then click on the Grapher application. Grapher is a graphing calculator with numerous capabilities for both 2D & 3D graphs. The 2D features include classic (linear-linear), polar coordinates, linear-logarithmic, log-log, and polar log. The 3D graphs include standard system, cylindrical system, and spherical system graphs. The screen shot on the right of the application's Example list shows eleven 2D and seven 3D examples. The Grapher - Getting Started tutorial by Rafid Hoda is an excellent introductory tutorial that shows how to find the application and many of its 2D uses and features. See also the description at Grapher Guide.
For a deeper 3D exploration, select any of the 3D examples from its pull down menu. One challenge might be to reproduce the animation below using Grapher: r = 4sin(10φ+T) for values of φ ≤ (pi/2) Where T animates between 0 and 2pi. Other movie demos: r = a(1 - cos(phi). Any 3D graph can be manually rotated and repositioned by clicking and dragging on the image. There is also a command to create a movie of a continuous animated rotation that can include zoom features. The animation below was created by the Grapher animation command.
Windows
MathMechanixs
A free 3D graphing application does not come built-in to the basic installation on a Win computer. Those needing one might consider downloading the currently free MathMechanixs program. For a brief demonstration, watch the screen movie below. Web site links below are available for searching for something better or different.
Cross-platform 3D graphing programs also exist. The Graphing Calculator 3D exists in an online version, and in downloadable versions for Mac, Win and Linux. The options include a freeware download version, and a standard and pro version for which there is a cost.
Excel runs on both Windows and Macintosh computers. Excel does some special tricks with category labels to create 3D charts. Any category chart which contains equidistant values will display properly, whereas distortions will appear if not. See the 3D Surface page that plots z=(x-10)3 + (y-100)2 (note that the exponents are not displaying in the proper elevated format) for an example. Some two dozen more examples of Excel graphing capabilities along with pages that explain how to make them are available at the same site.
Graphing Calculator 3D
A freeware application is also available for download called Graphing Calculator 3D.which works across all major platforms including Linux and Unix. It is available as an online application, a free download to all platforms and in commercial standard and pro editions. It can also import data files from Excel.
(OPTIONAL-extra credit) #5. Using Google Docs Online Spreadsheet Application
Learn how spreadsheets work in an online setting at Google Docs. If you have a login to blogger.com for Blog posting, or a login for any other Google service such as email, then you use the same login for Google Docs which contains word processing, spreadsheet, and presentation applications. Go to Google.com and using the pull down menu to reach Docs or go there directly, http://docs.google.com and play the movie on the Google Docs login screen (2:50 length).
Next, open up the 2007 or 2008 version of Micosoft Excel, then the Comparison spreadsheet and using the same name, resave this spreadsheet to the older format, Excel 97-2004 (2003) so that the file ends in .xls.
Log in to Google Docs and use the Upload button to upload the Comparison spreadsheet assigned earlier in this tutorial to your Google Docs account space.
Experiment with some changes to this spreadsheet to notice similarities and differences between Excel and Google Docs Spreadsheets.
Explore ways to Share the spreadsheet online.
That is, click Share in the Docs menu bar and use the "Invite people.." command to send me a message (use my department email address) and allow me access to edit the spreadsheet.
Return to the Share command and use the "Share with the world.." command to "Let people view without signing in" but NOT allow editing by those viewers.
Again click on Share and try the See who has access command to make sure my name is there with editing rights.
Return to the Share with the world command and copy the Web address to the clipboard (CTRL C). Use this Web address to also add a link in section VII of your unit plan under Comparison spreadsheet to the online Google Docs version.
Tutorials. Further training for Google Docs Spreadsheet can be found in many places including:
video, Google Docs spreadsheet tutorial at Atomic Learning (but only some are free, the rest require an annual fee of $99.99 though volume discounts for schools are available).
It should be noted that both Apple and Microsoft announced in 2009 that they would also be providing online access to common Office type applications through their own Web sites.
Finding Lesson Plans Models for Spreadsheets
One of the most basic ways to introduce spreadsheets is to use them for math story problems in place
of the chalkboard or overhead projector. Within the
cells enter the numbers from the story problem and label them, then create a formula that carries out
the required calculations. To create and or use a spreadsheet also emphasizes
many higher order thinking skills.
Analysis is certainly one of them. But
many thinking skills can be easily exercised with spreadsheets, such as
organizing, comparing, inferring and evaluating. Note that organizing is one
of the higher order thinking skills tested on the state's 4th and eight grade
exams. The use and creation of spreadsheets is required by the state's
Computer Literacy competencies for preservice teachers and their faculty
and inservice teachers.
With the approval by the State Board of Education of new standards for
computer literacy skills in the spring of 1998, spreadsheets are currently first
officially introduced in second grade through
K-12 Computer/Technology Skill competency goal 3.1. However, activities
undertaken in ealier grade levels than second grade help prepare for spreadsheet
use, such as the creation of bar charts and graphs in kindergarten. Such charts
involve students making comparisons between different columns or rows of data, a
common spreadsheet activity.
It takes hundreds of hours to be reading ready for books when children first come to school. It is equally important to get a high number of hours in with other applications including spreadsheets so they are digital literacy ready, let alone ready to carry out more advanced work. The odds of this happening at home are far less than with book reading so it is important for teachers to frequently integrate spreadsheet use in every content area from 2nd grade onward. Reading spreadsheets, not necessarily editing or creating spreadsheets, needs to be a significant part of this activity.
Study two of the several model lessons which are available for students in older
grades. Use such models to determine how you can incorporate spreadsheets into
your unit plan project. The examples below are just some of the examples that can be found by searching LearnNC.org for spreadsheets. Read through at least two of these lesson plans looking for ideas to use in section IV of your own unit plan.
The Little Yellow Chicken (grade 1 English Language Arts and Mathematics) The students will be following an integrated unit on "Helping." They will use reading, math, social studies, science, technology, and other areas of study. Students will read, as a group, the book The Little Yellow Chicken by Joy Cowley. The students will be incorporating prediction, prior knowledge, comprehension skills, and language skills for the word family "-ook", the vowel sound "e", and the exclamation mark. The technology to be utilized by the students consists of use of the HyperStudio for math review, Math Software, Graph Club to create a graph of favorite party foods, Inspiration to guide and create graphic organizers for writing, and the Ultimate Writing Machine to create their own version of The Little Yellow Chicken. They will also incorporate color words to practice the Spanish Language.
Weathering the water cycle: Precipitation. (grade 2 and 5 Science). Students will learn that precipitation is one of the three stages of the water cycle and how it relates to the other stages.
Weather watchers (grade 2 Computer/Technology Skills, Information Skills, and Science) This is a week long activity during which the students record the weather, track weather changes, and make predictions about future weather patterns.
Snails- Fact and Fiction (grade 2 English Language Arts and Information Skills) This lesson on snails integrates Science, Language Arts, Technology and Math. Teacher will share a fictitious snail story with students. Students will complete a K-W-L chart on snails with the help of the internet. As a related activity, students will take a poll on snail preferences and graph it.
Grammar Scramblers, Spreadsheets, and Parts of Speech (grades 3–9 English Language Arts). Students use and create Grammar Scramblers with a spreadsheet in order to practice identifying and using parts of speech in a fun way.
Spreadsheets for dinner (grade 4) Students will identify spreadsheet terms, create a spreadsheet about nutritional content of foods, and add the columns of the spreadsheet.
Introduction to Spreadsheets (grade 4 Mathematics) In this two-week unit the students will use a teacher made spreadsheet to learn how calculations work
Solar Sizzlers (grade 5 English Language Arts, Information Skills, and Mathematics) Group projects of building solar cookers or collectors provide arena for learning about energy sources and transformation. Gathering data for comparison and analysis exercises students' graphing skills and thinking.
Planets' relative gravity spreadsheet (grade 6 Science). The students use online resources to find information about the eight planets in our solar system. Then, using the relative gravity of each planet, they will create a spreadsheet to calculate what the weight of an average man and woman (possibly their own weight or the weight of other objects) would be on each of the planets.
ACC basketball (grades 6–8 Mathematics) The students will use ACC basketball statistics to practice the process of converting fractions to decimals then to percents and will learn how to create and edit a spreadsheet. They will then use this spreadsheet to analyze their data. This unit is done during the basketball season.
An Integrated Poetry Unit (grade 6 English Language Arts) My students have always disliked poetry. The different ways in which this lesson approaches poetry and the connection it makes to their "March Madness" studies seems to make poetry more enjoyable, fun, and relevant for my students. In order to integrate with the sixth grade math and social studies teachers, I teach this unit during the ACC tournament to coincide with the "March Madness" unit that is covered in the math classes.
Integrated unit on South America. (grade 6 Computer/Technology Skills, English Language Development, Mathematics, and Social Studies) This lesson includes information concerning database operations, word processing, desktop publishing, and spreadsheet formatting. Students will solve math problems.
Interdisciplinary Integrated Unit on DNA/Genetics Part B: Math (grade 7 English Language Arts and Mathematics) Using a teacher created math survey, students will collect data, create computer spreadsheets, charts, and graphs. They will answer teacher created math questions and answer these questions using percent, ratio, and their spreadsheets, charts/graphs. The students will complete a final journal writing assignment discussing their findings. The teacher will score students.
Coastal weather issues: Planning for a hurricane. (grade 7 Computer/Technology Skills and Science) The unit is designed for seventh grade students who have been studying Earth and its atmosphere. In this sequence, students are faced with the realistic issue of personal and social decision-making when planning for hurricane strikes, which includes classification, tracking, and monitoring hurricanes, as well as planning for evacuations. The inquiry-based approach involves a WebQuest in which the learner will assume the role of an emergency management team member who must create a preparation plan for the community.
Building a paper bridge: An introduction to problem solving (grade 8 Mathematics)
This activity allows the student to explore problem solving strategies while working with a partner. This activity (building a paper bridge), requires students to question word definition and the application of those definitions. Through problem solving strategies, students discover the need for applying math skills.
Using percent of change to measure NC growth (grade 8 Computer/Technology Skills, Mathematics, and Social Studies) Students will work in small groups to use the internet to gather data on the population growth for each of the 100 counties in NC from 1992 to 1995. From this data students will find the percent of increase/decrease for the counties they have been assigned. As a follow-up, the students will enter their data into a computer spreadsheet and from that spreadsheet, produce graphs of the information.
Using percent of change to measure NC growth (grade 8 Computer/Technology Skills, Mathematics, and Social Studies). Students will work in small groups to use the internet to gather data on the population growth for each of the 100 counties in NC from 1992 to 1995. From this data students will find the percent of increase/decrease for the counties they have been assigned. As a follow-up, the students will enter their data into a computer spreadsheet and from that spreadsheet, produce graphs of the information.
Winter Olympics: Inquiry into Statistics (grade 6–12 English Language Arts and Information Skills) Following the excitement of Olympic events, students are involved in an I-search http://www.avon.k12.in.us/hickory/pages/hickoryhome2.htm (click on Media Center then I-Search) activity that helps them develop question and search techniques. Their research provides them with data to enter into spreadsheets and display in graph format.
Other uses of spreadsheets and graphing by educators include preparation of:
tables (data in rows and columns); story problems; analysis of standardized
test results; survey results by teacher or student; collection and analysis of
science experiment data; social studies comparison tables; comparison of your
classroom budget, club, book order or special group budget; field trip
expenses; student financial management; personal investment, saving, checking,
expense and tax return accounts; loan repayments; retirement planning; and
exploratory data analysis.
Address of this Web Page: http://www.ceap.wcu.edu/Houghton/EDELCompEduc/Themes/spreadsheets/spreadsheets.html
 On Mac computers, an excellent but not widely known graphing application called Grapher ships free with the computer. Open it by clicking the hard drive symbol, then the Application folder, then the Utilities folder, then click on the Grapher application. Grapher is a graphing calculator with numerous capabilities for both 2D & 3D graphs. The 2D features include classic (linear-linear), polar coordinates, linear-logarithmic, log-log, and polar log. The 3D graphs include standard system, cylindrical system, and spherical system graphs. The screen shot on the right of the application's Example list shows eleven 2D and seven 3D examples. The