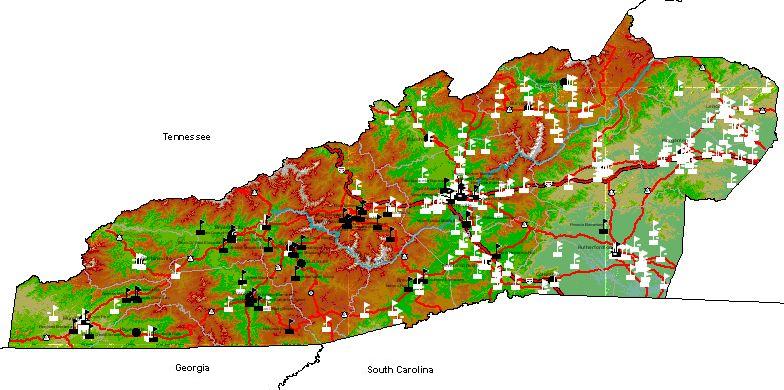
How many layers make up this map above?
The above map of the location of public schools in our region is composed of several layers of data that are pulled from a GIS database on the GIS user's direction. GIS stands for Geographic Information Systems. The WCU specialist who supported and taught Dr. Houghton much of his GIS knowledge is Anita Oser, Director of the Map Library, a facility which is found on the map mezzanine of the library. Their public school GIS map project is still ongoing.
Some 80% of the data or information we use for teaching, learning and thinking has a spatial element. GIS software and hardware empower users to make powerful and effective thinking activities with such visual data. Computers provide the ability to store large quantities of information efficiently, provide visualization tools that imrpove analysis and display, and offer a wide variety of maps. The use of GIS is growing at some 20% a year, an industry that is already generating some $3 billion a year. Many content areas that we teach make significant use of GIS. Science: Environmentalists, scientists and farmers need to map the distribution of soil types and soil moisture and track the distribution of plants, animals and their habitats. Social Studies: Police agencies map the location, nature and severity of crimes and city planning departments use it for short and long term planning and zoning. Comparisons among counties, states and nations are simplified and extended through GIS.
Another excellent example of the application of the knowledge can be found in Buncombe County, North Carolina. Here an organization called RiverLink is working to restore watershed quality in the region of the French Broad River, increasing both the environmental health of the region and improving its economic vitality. Visit the RiverLink web site to see how they make extensive use of the output of GIS software. Such organization of information and people makes it easy for classroom teachers to develop teaching projects that contribute to the overall effort. GIS thinking is just one component of the larger movement in the sciences to do more with scientific visualization.
How many layers make up the map above? This link provides the answer to this question first posed in the first paragraph.
Move next to directions on how to find, install and use the ArcVoyager program.
Mathematics, Spreadsheets and Thinking Home page | Page author: Houghton
Updated September 18,2004