It is a growing paradox that there is infinite wealth in the mine of knowledge, but stifled and dropping capacity to get it out. Why?
These thoughts address an astoundingly powerful yet silent and nearly invisible explosion and transformation of the world of data to quantities that challenge our understanding of numbers. Hilbert and Lopez tracked the rate of growth at 23% growth a year in stored information alone through 2007 (2011^); IDC studies pushed the rate of growth to 40% a year through 44 zettabytes of data in 2020 (IDC, 2014^). An important but inadequate number of new literates already use digital technology and computers to exploit this endless growth in information, forming society's most economically fruitful and entrepreneurial class while also contributing to the greatest economic inequality in American history (Florida, 2012^) and greatest educational inequalities. The literacy needed to be able to meaningfully understand, analyze and contribute to the knowledge flow in the world's data has radically changed at the same time that educational systems have been increasingly stifled. Such developments indicate a need to accelerate our awareness and response to growing gaps that are forming major challenges for the knowledge society. What characterizations of the emerging knowledge society will help us understand it better? What gaps in our knowledge does this change reveal? What must we do to thrive and help others thrive in a knowledge society?
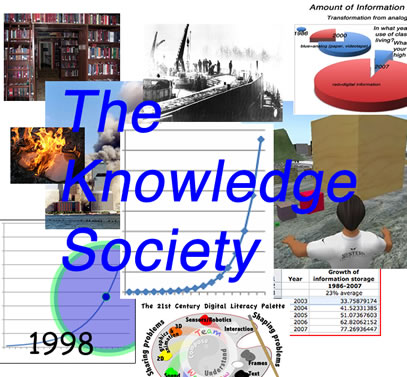
Teachers and learners in the 21st century age of information face a special challenge. "We are living in one of the most momentous times of change in human history" (Davidson, 2011^). The knowledge explosion that seemed like distant rumblings when the concept and later the phrase "information explosion" emerged in cultural awareness decades ago (Bush, 1945^; Machlup, 1962^; Tyler, 1965^) is really a part of a long upward advance going as far back as the last ice age (Wright, 2007^). Today the information explosion (Guo & Kraines, 2009^; Wilson, 2010^) has become more like an accelerating series of thunderclaps. Consequently, the ideas that we must learn more about and then share will increasingly change, at a rate of change represented in part by the graph on the left, a discussion which will receive some further multimedia unpacking ahead. This curve is its mathematical expression; however, it implies something that it is not. As each new idea does not merely add something, but has a ripple effect that changes the context for everything else (Gladwell, 1999^; Postman, 1992^), this constant surge creates a hunger for deeper reflection and analysis. In contrast to a known and predictable future implied by the smooth curve of the graph, the cultural resonance of these exponential developments in the knowledge society is not predictable change; instead we have frequent nonlinear leaps in seemingly disconnected and surprising steps to some future unknown point. The tsunami of data (Wurman, 1997^) that has continued to strike our cultural beaches is one more of the many 21st century exponential trends (Houghton, 2011a^) which are all driving each other.
The rapidly changing nature of this explosive development has opened significant gaps in our culture, gaps which impact the role of education and the direction of our culture. They will be represented and later explained in part using images in the collage of pictures above. To close these gaps, cultural leaders including educators must "teach into" the information gaps in storage, analysis, composition, access (the digital divide), response to change and control. As these gaps appear at the moment to be growing instead of closing, breakthroughs in awareness, policy, teaching methodology and digital technology are needed not only to create more opportunity for all citizens but to solve the multiple significant local and global problems that surround us. The identity and spirit of the knowledge society will emerge from its encounter with these gaps.
The term "knowledge" is sometimes viewed in a hierachical sense, with data as the base, then additional narrowing layers adding information, knowledge, understanding and wisdom. Rather than joining the discussion on the relevance, relationship or reality of such a pyramid, here "knowledge" is used in its most generic sense and the related terms when used are done so rather synonymously.
Even back in the age of steam power, the inventor of the unfinished design for the world's first computer, Charles Baggage, was recognizing that "knowledge is power" (Babbage, 1832^). Through his study of the progress that science had made in designing gears and levers to be controlled by steam he also saw that "knowledge is itself the generator of physical force" (Babbage^). The industrial age played an important role in the reconceptualizing of knowledge as something separate from the object demonstrating power. The degree to which the science and engineering knowledge of steam power would have impressed and often stunned its generally horse-and arm-powered observers in the first stages of the industrial revolution can still be seen today. A visit to the engine room of the occasional authentic paddlewheel steamboat reveals the awe-inspiring characteristics of original steam engines: loud, large and ingeniously designed force.
Today, world culture is transistor powered: noiseless, tiny and ingeniously applied power control. This ongoing evolution in the nature of information has numerous social implications (Drucker, 1969^; Garham, 2004^; Machlup, 1962^; Machlup, 1980^). In a series of books, the Tofflers (1980^, 1990^, 2006^), Castells (2000^, 2010^), Drucker (1993^) and Shapiro & Varian (1998^), among others, established the idea that knowledge (information) had become more powerful than wealth (capital) which in a preceding era had grown more powerful than the physical power that drives much of agriculture, industry and police and military systems. One sign of the information age power transformation from 1950 to 1980 was that manufacturing goods had been eclipsed by information management as the dominant economic activity in the world (Toffler, 1980^). "Internet-related consumption and expenditure, if measured as a sector, is now bigger than agriculture or energy" ("Big Data", 2012^). Surpassing both capital and labor, data has become the new oil, the new raw material of business ("Data", 2011^). Knowledge has become the "primary engine of economic growth" (Birkinshaw, 2005^). Enormous quantities of this "new oil" are free. For those living on the poorer side of the digital divide, including public schools, these developments are of tide-changing importance. But it is more than the new power; data is a very different cat than capital and labor. Failing to understand its distinctive nature will cause many analyses to fail in thinking about how to integrate this new power into our educational and cultural systems.
The Nonrival Nature of Information
There is an important paradigm shift that needs to be made. Much of the cultural intuition that has been developed and integrated into legal systems around power and ownership is based on "rival" thinking; someone's taking means someone's losing. Unlike prior sources of power (money and force), information has the unique economic property of being "non-rival", a 'nonzero sum' form of thinking in which participants can all gain (or lose). That is, buying or taking my dinner plate prevents me from using it but taking my recipe idea and using it does not keep me or an infinite number of others from using it as well. Said more elequently by Thomas Jefferson, "...he who lights his taper at mine, receives light without darkening me" (Jefferson, 1813^). One might also add, that she who lights her candle at mine doubles my own light.
The combination of information's power to enlighten, the Net as a data distribution system and information's non-rival nature have created a society in which, at least in the context of information, the ability to pay is no longer the major criterion determining the provision of information goods and services. Further, collaboration, not competition has become the most effective form of organizing economic and social affairs (Shirky, 2010^). This direct contradiction to Webster's review of the theories of the information society (2002, p. 268^) that this was not the case is one more marker of the changing times.
The characteristics of the age of knowledge have already led to the development of significant free and cost-of-materials resources for storing, communicating and processing information alongside significant growth of competitive knowledge organizations (both profit and nonprofit). The knowledge society is characterized by numerous open-source downloadable software applications (e.g., OpenOffice, Audacity, etc.) for computing or processing information for all kinds of problems. It has also led to hundreds of free Web applications in dozens of categories with global impact such as search engines (Google & Bing), life-saving crisis managment (Ushahidi), global banking (Kiva), a copyleft revolution (Creative Commons copyright) in protecting public intellectual property and free online global storage and publishing via social networks (Facebook), wiki engines, blogs (Twitter), and other media distribution systems (e.g., podcasting, Flickr, Google Docs and YouTube).
The nonrival nature of information also greatly facilitates social coordination. Users of information make progress individually and culturally by stepping upwards through levels of increasing social coordination. This social coordination begins with sharing and then progresses onward to cooperation, collaboration and collectivism (Shirky, 2009^) to create enormous social benefit by turning cognitive surplus into value (Shirky, 2010^). These ideas have been extended by the Web to the larger cultural setting creating a sense of expectation about further liberating cultural developments to come (Tapscott & Williams, 2007^, 2010^).
Such social progressions have long been recognized as important to classroom teaching and learning, yielding better grades and better people (Johnson & Johnson, 1994^; Slavin, 1980^, 1983^; Tsay & Brady, 2010^). Social teaching techniques include jigsaw, group investigation, think-pair-share and literature circles. As educators are a kind of information specialist on minimalist budgets, they have a particular need to both understand, use and explain these key evolving characteristics of information, integrating them within school contexts and teaching methods.
![]() This simple animation also creates an opportunity to address, to teach into one of the forthcoming discussions on gaps, the composition gap. An introductory tutorial series on how to do similar simple animations using Adobe Flash animation software is therefore provided. Additional such tutorials will also be preceded by the screencast icon with the red apple in the center.
This simple animation also creates an opportunity to address, to teach into one of the forthcoming discussions on gaps, the composition gap. An introductory tutorial series on how to do similar simple animations using Adobe Flash animation software is therefore provided. Additional such tutorials will also be preceded by the screencast icon with the red apple in the center.
The inclusion of such "sidebar" tutorials such as the one above and further ones still ahead is a challenging issue for those that have various levels of multimedia literacy. That is, it is both time consuming for authors and potentially seen as challenging by readers and professional journals. It can be distancing for readers in that it can be seen as a distraction, a turning away from the point at hand, unless readers recognize that this simply requires a two-pass style of reading, once for the content and once for the tutorials. Depending on how they conceive their mission, it can also be distancing for journal publishers. Such work requires further editing and requires additional file space and Net bandwidth to support such work. Professional journals in the field of education and elsewhere have yet to fully embrace the complete range of media enabled by Web publishing. This line of thought about embedded tutorials would make it even harder. But by not providing explicit help to enable others over this digital wall, authors and journals extend and reify an age that is passing. If, however, journals and educators see that part of their mission is to model and improve digitally literate composing and thinking, the 21st century obligation to teach the new literacy must come home to roost.
The Three Major Types of Information Management
The rapid growth of information provides a constant source of change, new opportunity and also a staggering challenge in comprehending the nature of the change due to its enormous scale and generally invisible nature. The management of information can be split into 3 major divisions, each evolving at their own unique pace: storing information (reaching across time, 23% growth per year); communicating information (reaching across space, 28% growth per year); and computing information (composing or processing, 58% growth per year) (Hilbert & Lopez, 2011^). The impact of that growth is continually revealed in a number of cultural changes whose implications are still being discovered and analyzed.
Recent, Massive Increase in Information Quantity
The animated graph on the right represents the growth of the world's capacity for storing information, growing 23% a year from the level of 1986, to reaching 800% growth by 1996 and 4100% growth by 2004. The animation is relevant here because comprehending the scaling nature of such mathematical growth is difficult to correctly grasp and is not an intuitive understanding one would reach from looking at the graph in the opening paragraph. But animation is just one multimedia way to extend our understanding, as will be explored later.
The animation on the right loops endlessly. The inner circle within the larger circle represents two ideas. First, it represents the size of the world's archived information in 1986 which contrasts in each passing year with the growing outer circle of new information. Second, it also represents the year of the graph data at the given point in time in the exponential curve of the graph. The growth of data is so great that the last 3 years cannot be shown because the edge of the bubble representing the percentage growth in data goes beyond the display space. The idea that the small circle represents all the information stored by mankind in all locations on all continents of the world in the year 1986 takes some pause and contemplation. This includes all text (books, magazines, newspapers, reports in file drawers, etc.), video, audio, television, movies and so forth. To build actionable intuition about that accelerating growth in the larger outer circle may require some imagination and further consideration. By 2007 what was once analog data stored on library bookshelves has been massively expanded by the addition of digital data.
To see the complete graphic scale the bubble outward toward its proper 7,700% size in 2007, open a new page to see the full animation. This idea can also be taken further. If this 23% trend continued through the four years after 2007 and through 2011, the bubble would be over twice as big, twice the displayed final size at 14,378 percent of the 1986 measurement. The quantities reached stagger our understanding through using names for numbers that are not in common use; they are so large that most of us lack metaphors for comprehension, a problem addressed throughout these thoughts in multiple multimedia ways. In absolute values for the final year of their study, 2007, stored information was measured at 295 exabytes, the largest size of the outer bubble in the animation.
As impressive as what that quantity of stored information represents, the amount of communicated information via broadcast networks (e.g. phone, radio, television) was over six times larger in 2007, passing the 1.9 zettabytes mark at a speed of 28% growth a year (Hilbert and Lopez). Of the three forms of information, stored information is the slowest in rate of growth, 23%.
![]() Here's another one of these "asides" that addresses the composition gap problem still to be discussed ahead. This tutorial series on scaling using animation talks and step-by-step demonstrates the process of composing this more complex animation composition using the Microsoft Excel spreadsheet and Adobe Flash animation software. Animation is one of the standard forms of composition routinely used on the Web to communicate in ways that words and other media cannot. The screencasts are also a demonstration of another routine form of Web communication not routinely taught in the language arts curriculum of our educational systems.
Here's another one of these "asides" that addresses the composition gap problem still to be discussed ahead. This tutorial series on scaling using animation talks and step-by-step demonstrates the process of composing this more complex animation composition using the Microsoft Excel spreadsheet and Adobe Flash animation software. Animation is one of the standard forms of composition routinely used on the Web to communicate in ways that words and other media cannot. The screencasts are also a demonstration of another routine form of Web communication not routinely taught in the language arts curriculum of our educational systems.
Others studies that have focused on the years after 2007 have reached much larger numbers for the current state of stored information. The Internet alone is a huge contributer to the data surge, with estimates of 667 exabytes a year by 2013 ("Data", 2011^). Google statisticians have reported that in 2010 total stored information was 800 exabytes, more than doubling the Hilbert and Lopez's measurement in 2007 (Finn, 2011^), and more than what the extrapolation of the Hilbert and Lopez study would have predicted. That is, their 23% growth rate for stored information may have been too low. The International Data Corporation (IDC) a global provider of market intelligence, in its fifth annual study of just the stored information in the "digital universe", reported a still greater number. They reported that the zettabyte line was crossed in 2010, and in 2011 "the amount of information created and replicated will surpass 1.8 zettabytes (1.8 trillion gigabytes) - growing by a factor of 9 in just five years" (Gantz & Reinsel, 2011, p. 1^). Their projection for 2012 was 2.7 zettabytes (IDC, 2012^).
Then Chief Executive Officer of Google, Inc., Eric Schmidt, noted in a 2010 speech: "There was 5 exabytes of information created between the dawn of civilization through 2003, but that much information is now created every 2 days, and the pace is increasing" (Tynan, 2010^). Put another way, if a byte was a bucket of water, then using the 2010 rates of data production there would be enough buckets of water to fill every ocean on the planet almost 2.6 times a year ("Be more competitive", 2013^). Given the 23% growth in data storage a year, the world began doing more than 3 ocean refills a year in 2012, 3 zettabytes of data. In what year will the world be doing the equivalent of 4 ocean refills of stored data a year? In the year 2020, projections indicate that 7 zettabytes will be stored ("The location of data", 2013^). If a byte was equal to a square meter, at what quantity of data would the square meters exceed the width and breadth of the milky way (Proffitt, 2012^)?
Stored information is different than transmitted information; Cisco's 2012 forecast covering 2011 to 2016 predicted a four-fold increase in Net transmission to 1.3 zettabytes a year (Savitz, 2012^). These varying figured would suggest that each effort at measurement has used different methods, yet each have confirmed the overall concept of the astounding size and exponential growth of the quantity of information. Some additional ideas for grasping the enormity of these values will be discussed shortly using just the more conservative measurements by Hilbert and Lopez. In light of such quantities, what does it mean to be "well read", knowledgeable and contributing effectively to solutions in the 21st century?
It also worth noting that in the year that was used as the beginning point in Hilbert and Lopez's study, 1986, this time period was already part of a long prior era of rapid change, data growth and technology revolution. The well-known and respected business consultant Tom Peters was writing extensively in the 1980's about the revolution in business and organizational principles and practices, later recognizing in his second edition of Thriving on Chaos the key role that the "pioneering use of information technology" was playing in business transformation (Peters, 1986, p. 636^). The Tofflers' book titled Future Shock was published in 1970. By 'future shock' the Tofflers' meant that staying in one place and dealing with the rapid change in your own culture was equivalent to the "cultural shock" of moving into another culture and another language. The term "future shock" was coined in an article written five years earlier (Toffler, 1965) by observing the cultural shock of change occuring in the 1960's. In the same year Tyler (1965^) was writing in Educational Forum of the significant storage problem of great libraries running out of shelve space brought on by knowledge doubling every 10 to 15 years. Toffler's work built on Machlup's (1962^) who began researching and writing about the data explosion in the 1930's. This future shock idea was expanded later by Yudkowsky into a range of future shock levels (2001^) to address a range of future projections that one can deal with rationally and non-emotionally. Note that Toffler's original 1965 article on future shock was published 21 years BEFORE the 1986 year that served as the initial point of measurement in Hilbert & Lopez 's study of the data explosion. That is, this exponential growth in information has been recognized as impacting culture for many decades, not just the last two with the advent of the Internet and the Web.
As massive though largely invisible as the current data explosion is, it is important to recognize the forthcoming arrival of totally new significant forms of information that are immediately pending and therefore just beginning to be captured in measurements of information. Three areas of development have signficant potential to add to the information explosion in the near future, sensor systems and digital fabrication (including 3D printers, laser cutters and related devices) and personal biological data.
The growth of existing sensor systems which generate data is just the first trickle of expansion. "In the second quarter of 2010 AT&T and Verizon announced that non-human objects - interconnected devices - came online in greater numbers than human subscribers. The Internet of Things is here, penetrating society quietly and efficiently" (Oxford, 2011^). Companies have already inserted some "30 million sensors into their products, converting mute bits of metal into data-generating nodes in the Internet of Things. The number of smartphones is increasing by 20% a year and the number of sensors by 30%" ("Building", 2011^).
Buried within software protocols in the 2011 arrival of the new Internet labeled IPv6 was a new layer of potential that many refer to as the new foundation for an Internet of Things. This new IPv6 Internet technology was needed to replace the existing Internet infrastructure which had run out of numbers to identify new devices. It also as added a new set of computer code that will enable extremely small, cheap and powerful sensors to be put in locations and attached to things at a scale rivaling the placement of bar code on goods in retail stores. Each IPv6 ready sensor will have its own IP number, able to report in their sensor information as programmed. Engineers who have been preparing this technology have estimated that over 20% of the non-video traffic of the Net will come from Internet of Thing sensors in just a few years (Vasseur & Dunkel, 2010^). Experts have estimated that this will push the Net to over 7 trillion interconnected devices by 2017 (Oxford, 2011^), coining the phrase "tera-play" for trillions of devices at play. However, well prior to the arrival of IPv6, the effort to track and socially trade sensor information in the same way that YouTube and Flickr trade in video and photos is already well underway. 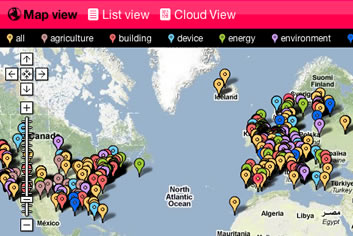 This is of great value to the STEM agendas of science, technology, engineering and mathematics and represents another new means of communication for the language arts curriculum of our educational systems to integrate.
An example of the growing data from sensors is provided by the linked image (on the right) from the web site Cosm (scroll to see the map). This site was formerly called Pachube, a name that is still a part of many of their Web pages. This site provides clickable placemarks leading to sensor information shared from users from around the world that have chosen to provide public access to their sensor data that could then be in turn used in other ways from controlling robotics systems to live feeds of data displayed within future Web compositions.
This seemingly unimpressive inclusion of live data within a Web page also does something momentous to composition. With online sensors and robotics, the composer/author can cite or reference the basis for an idea in a composition ever so directly to a sensor reporting a current fact in the physical world. Prior to this capacity, as demonstrated throughout this document, the citation or supporting evidence for an idea comes from some evidence or data that was recorded in the past. Linked live sensors would mean that no matter when the composition was created, later readers will still see the current, updated, correct information. It would then be possible to read an article ten years after it was written, but see live data current at the moment of reading, data perhaps summarized in a graph or chart using the same current data. However, the analysis and conclusions in the article would be based on data that was available ten years ago. The later data might disagree or disprove the very point that the author used the original data to make. We may be using "if" a great deal more in our future compositions.
This is not an end point in the quest for truth as any system can be faked, but when using trusted resources, the conceptual and intangible nature of much of composition can become more grounded, anchored into the present, while still including the possibility of simultaneously archiving the past. The implications of thinking and composing in ways that include live data and sensor feeds need further exploration and experimentation by those engaging in 21st century composition.
To fabricate is to make or assemble something. As with the evolution of computers and printing machinery, once again in history what was once the special province of large building spaces (factories and computer centers) and specialized personnel is evolving to be done from the physical desktop (Anderson, 2012^; Gershenfeld, 2005^; Lipson & Kurman, 2013^). In short, the world is heading towards a set of three dimensional (3D) data that describes every object that we can imagine in all its variations. For example, pause for a moment and note how many different kinds of chairs you see in a single day. Now imagine that anyone can take a computer model of a chair design that you see and tweak and adjust it to personal preference, producing another variation on "chair". This 3D data file will contain sufficient information for some form of automated production system to actually manufacture the device, some combination of 3D printers, laser cutters and other automated devices. Much of the discussion in the news, government policy debate and scholarly literature about 3D fabrication has focused on 3D printers, but laser cutters (tutorials) and computerized textile and sewing machines are an important but less visible part of this scene.
Objects that are small and not too complicated are increasingly being produced on home and office 3D printers. Other objects require a larger production system that will easily fit in the floor space of your average small business store. Somewhere, all this digital design data will have to be stored. Currently, the largest site for sharing free versions of 3D printable files (STL files) is Thingiverse, which by February of 2013 contained over 30,000 downloadable files of things (objects) that were publicly available to create using 3D printers. Other sites include: Trimble 3D Warehouse (powered by Google); 123D (powered by AutoDesk); 3Dvia Content Warehouse; and 3Dfile. Sites such as Shapeways charge for their 3D printer design files. One might also suspect that in the future each 3D printable object will generate significant quantities of related data; an object would come with links to numerous still image examples of the output with different color and design possibilities and include YouTube videos of how to polish and/or assemble each one.
The emergence of 3D fabrication is more than just a change of machinery size and location. Many see these devices and their digital fabrication files as a third industrial revolution. Computer directed object fabrication represents a cultural shift with the real history making potential. Within view is the possibility of malls and downtowns of local economies loaded with skilled artisans in effective competition with mass produced and mass marketed goods that has not been seen since the beginning of the industrial revolution in the 1800's.
Computers played a critical role in the Human Genome Project in sequencing all of the genes in all of the chromosomes in the human body by 2006, our 48 chromosomes holding 19,599 genes. In turn through RNA these genes encode some 40 billion proteins which come in hundreds of different variations that constantly change and which carry out all the functions in our bodies (Saporito, 2013^). Knowing the sequences and variations within each of us takes massive computing power to do the analysis and massive data storage capacity. Each of us may be generating petabytes of data to complete the analysis on our own unique variations of genes and protein interactions.
To the basic characteristics of information discussed to this point (non-rival, 3 major types and rapidly expanding quantity) there is another notable feature, a change in the quality of the way information is stored.
Recent, Massive Change in Information Quality
Within this almost incomprehensible growth in the quantity of information, a key change in the qualities of information is also occuring. There is a shift from analog to digital storage and transmission of information. 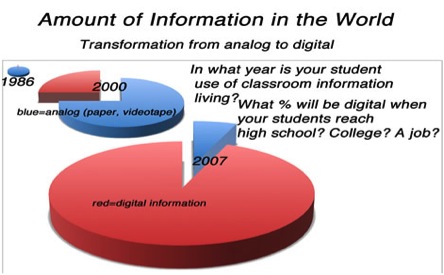
As revealed in the graph of this paragraph, in 1986, a tiny fraction of the world's information was stored digitally, the tiniest blue circle with a sliver of a red line in it. By the year 2000, the second pie chart, 75% of the world's information remained in analog format (paper, videotape, etc.), but that sliver had grown to 25%. In 2002 (pie graph not shown) the tipping point was reached with a pie chart that would be 51% red and 49% blue. In the third much thicker pie chart, the sliver has become king. By 2007, 94% of the world's 295 exabytes of data was preserved digitally, the largest red pie in the graphic. In one explanation of this number, the quantity of 295 exabytes equal a stack of data filled CD's piled from Earth to the moon and a quarter beyond (Hilbert & Lopez, 2011^).
These graphs beg the as yet unanswered question as to how much greater the digital percent is in the present, but research has not yet made this answer available. In short, almost all of the world's data is in a digital format somewhere. That is, those who have a computer and know how to navigate the world's information have considerable access to a massive treasure trove of information. Of course access is not the same thing as the ability to do something with it once accessed. Those without the technology and the ability have a greatly reduced set of options.
Finally, where this digital data is being stored is also shifting. As the red wedges in the pie graphs below show, in 2011 the percent of data in the "cloud" or global network was 25% and it is projected to shift to 61% by 2020. That is, the world's stored data will be massively shifting from storage on local computers and devices to the cloud or global network. At the same time the amount of data represented by the entire pie swells from 1,800 exabytes in 2011 (Gantz & Reinsel, 2011^) to a projected 7,000 exabytes of stored data ("The location of data", 2013^).
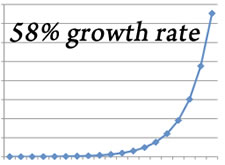 The accelerating growth of information created a huge need for analysis, problem discovery, "data mining" and data processing. This need helped accelerate the rapid adoption of the processing technologies of personal computers and supercomputers with distributed computing over networks using massive computer grids and data warehouses. The Internet and World Wide Web is one part of that response. The exponential curve of change graph on the left also represents the nature of the 58% annual growth in the capacity for digital processing, double the rate of growth in the other two major branches of information management. As an example of that improvement, compare the original ENIAC computer of 1946 with the common but highly reliable iPod carried in the palm of the hand. The ENIAC required a giant room to process information at 5,000 operations per second (and did so rather unreliably) while today's iPod operates at 2.4 billion operations per second (Busse, 2010^). This single example is a mere 480,000 percent growth in processing power over that time period. In fact, the iPod technology operates at a snail's pace compared with supercomputers operating at petaflop operations per second while marching towards exaflop speed (Houghton, 2011b, ^). However, faster computing and processing power is meaningless without the equally explosive growth that has also occurred in software applications. These tools enable digital processing, that is processing information in a variety of digital ways, including analysis, composing and communication.
The 58% growth in the power to process information is a combination of both the growing availability and quality of the digital palette of "software paint" and the availability and quality of computing hardware hardware. This growth is more than double the very significant growth in both capacity to store and communicate or transmit information. 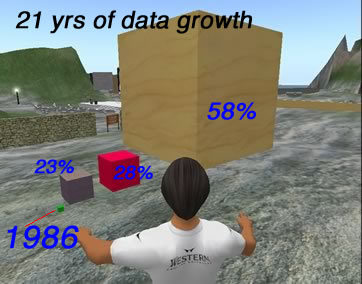 The implications of this greatest of the three growth rates can be hard concepts to visualize. The image in this paragraph is of 4 cubes created with the precision of 3 decimal places. This scene was constructed in one of the hundreds of 3D virtual reality worlds, one known as Second Life (secondlife.com).
The smallest cube, the tiny green box, represents the year 1986 for information storage, communicating and processing. The next three cubes represent the comparative growth in each, continuing the data trend on to the year 2011. The second largest box, in purple, stands for the 23% growth in information storage since the green box of 1986. Though it looks relatively small in comparison with the larger boxes, recall that the size of this purple cube represents a skyscraper building full of books for each citizen on the planet. The next larger in size, red, is the 28% growth in communication capacity. The largest sandstone textured cube is for growth in our capacity for information processing. The result of 58% growth is a much larger outcome than those with a much slower growth rate.
To further gauge the import of this 3D graph though, there is still some missing data. What percent of our classroom and world population is capable of using this significant growth in processing capacity? What is their degree of literacy with the tools of digital palette? It is also begs the question, what ways do we have to categorize the skills that are now being used to process and compute information? At what pace must our learning of the processing power of digital systems grow to keep up with this expanding capacity?
![]() This graphic also creates an opportunity to address, to teach into this composition gap. In an age in which so many text literate citizens are digitally illiterate, unable to compose and think in so much of the range of the digital palette, the Web provides a ready opportunity to create and share aspects of how media compositions are done. Ready availability of screencasting software should make this obligation rather strident. Consequently, an introductory tutorial series of screencasts on how to compose using Excel and 3D objects in Second Life is therefore provided.
This graphic also creates an opportunity to address, to teach into this composition gap. In an age in which so many text literate citizens are digitally illiterate, unable to compose and think in so much of the range of the digital palette, the Web provides a ready opportunity to create and share aspects of how media compositions are done. Ready availability of screencasting software should make this obligation rather strident. Consequently, an introductory tutorial series of screencasts on how to compose using Excel and 3D objects in Second Life is therefore provided.
But why is pondering the increasing deluge of data and its qualitative transformation to digital structures so important in general and in particular to our systems of education? Accelerating growth in the quantity of information buries or obscures undiscovered problems. It also makes new solutions more difficult to find. Making information digital only helps if the digital tools and minds for sifting and recomposing this information can handle the quantities. It only helps if our culture is increasing the numbers of its citizens who can manage the tools, do the analysis and discover the information, the issues and the questions. It only helps if they can use their digital skills and digital data to creatively compose solutions to the problems that were discovered. It would be a great oversight to be so struck by the hard data of the freakish numbers that the problem becomes defined as one of merely adjusting technical skills for exploiting greater speed, quantity and variety. It is not just about skill to handle faster and more. It is the qualitative changes that have perhaps the most capacity to create volcanic changes rippling throughout world culture.
In the midst of an information storm that is occurring at "one of the most momentous times of change in human history" (Davidson, 2011^), it is hard to see how profound an impact the data explosion is having unless there is some historical perspective and measurement by which qualitative comparisons can be made. One huge qualitative change happened as the world transitioned from oral to written culture. Much of the story available about such a time of cultural change is filtered through the long detail robbing expanse of thousand of years in which the world moved to oral and then to written culture. However, the major conceptual transformations are still visible. "The move from oral culture to literate culture is profound. Oral is additive, aggregative, participatory, and situational, where literate is subordinate, analytic, objective, and abstract" (Brand, 2007^). In an oral culture one is limited to the amount of information that one can witness or hear and recall, which is further limited by the number of people that one can find and contact. Reviewing information for recall or accuracy means finding that person again or having that experience again. Written culture made the archiving of information possible and those cultures that developed a written language demonstrated their awareness of that value by creating ever larger libraries to hold the papyrus and paper which contained the information.
The move from written culture to digital culture is equally profound. The new mix of archiveable media in the twenty-first century includes oral forms that are reappearing in text messaging, twittering, video sites like YouTube and podcasting (Brand), and the written culture has shifted to a digital culture where the creative class is blending all the media types and associated cultural perspectives that came before it. Our new digital literacy along with almost every other business and field of practice is also being undergirded, transformed and driven by a new highly analytic and abstract literature, the literature of computational thinking made tangible by computer software and those that authored it (Andreessen, 2011^; Kirkpatrick, 2011^; Rao, 2011^). In a further twist, one of the most common and rapidly innovating areas of computational thinking amplifies the networking and social strength of the Net, an oral culture characteristic. Collectively, all these developments have led to a wide range of media for composition and communication that are now in common use in the world's Web pages and across the multitude of apps in use on mobile and other digital devices.
In short, software provides the tools to refine the data, to draw value from the gushing "new oil" of data. But the presence of this new oil and software's capacity for computational thinking that can process it leaves a gap to cross. If sufficient numbers of educated people could be found to use this software to analyze the data, what skills do they need? What must be added to thought processes to effectively apply the computational thinking of software design to the surge of data? One profitable bridge across this gap is the ability to apply human creativity, as demonstrated in the graph below.
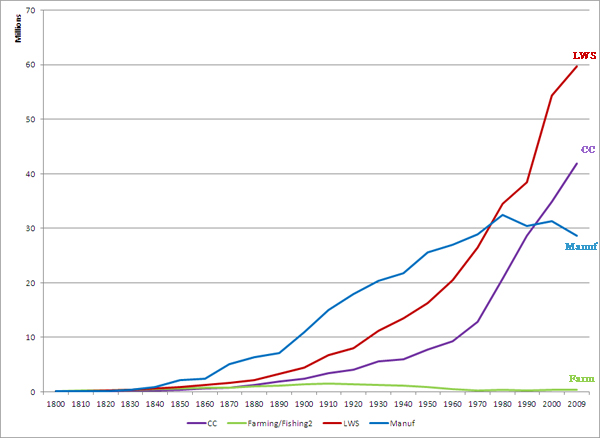 By looking at the changing roles and surge of new jobs in the economy, it is possible to see where a culture is finding its greatest needs and sees the most opportunity. The graph shows the change in the millions of people employed in four different classes of workers (Florida, 2011^). Endless volcanic quantities of data that need to be processed by analytical and creative thinking have been a key foundation for the formation of the "creative class", the purple line labeled CC in the graph on the right. The purple CC line does not have the highest number of jobs; it has the highest paying jobs.
It is this creative entrepreneurial and thinking talent of the CC occupational class of jobs whose contributions have done the most to grow the economy and thereby draw ever higher wages over the last 200 or so years. This is compared with low wage service sector (LWS), the declining numbers of jobs manufacturing (Manuf) and the almost non-existent number of jobs in farming (Farm) jobs (Florida, 2011^; Florida, 2012^). Service sector jobs (LWS) requiring the least higher level thought are the easiest to fill and consequently command the lowest wages; they provide services to all the other sectors. The declining number of manufacturing jobs in the United States is only in part a result of factories moving to cheap labor countries. The United States is still the number one country in the world for manufacturing output. The drop in manufacturing jobs is far more related to the expansion of automation and robotics; with the arrival of automation, fewer but higher paying jobs are developing, jobs that require ever higher levels of skill. However, the nonrival nature of knowledge and the boost to productivity by advancing technology has resulted in a shift of employment from the competitive capitalist market to the collaborative nonprofit market, which is the fastest growing job market in the United States with over 10% of the market (Rifkins, 2014^).
Note the exponential nature of purple Creative Class growth, a curve which does not fully match the exponential curves of data growth but rather appears to be chasing it in a losing effort to catch up. This explosive growth in data whose exponential curves are sharper than the job market in the CC provides the Creative Class with a seemingly infinite opportunity to continue to grow not only the CC job market and but CC wages as well. This creates a rather clear target for educational systems. The more creative and analytical thinkers our educational systems produce, the better it is not only for those individuals but the better to grow the wealth of the economy which in turn raises the tide for everyone's boat.
It is also clear that our educational systems are struggling to produce the right types of creative and analytical thinkers needed to today's market. Even with the rapid rise of the Creative Class, technology leaders in the United States struggle with the 65,000 person cap on employee visas per year. Companies cannot find sufficient American workers for many core creative positions. Quoting from Bill Gates, co-founder of Microsoft, testimony to Congress in 2008: "the cap bears no relation to the U.S. economy's demand for skilled professionals" (McDougall, 2012^). Capped by this limitation, organizations have been forced to shift new development in creative and analytical jobs to where the talent is located, building new centers of creativity, research and development within other countries all over the world. Naturally the associated wealth creation and taxation from such activity is then also shifted away from the United States. A cap on visas while also tightly squeezing the funding for educational systems, the very systems that are struggling to produce the types of people with the needed skill sets, must be seen as one of the most astonishingly naive and self-defeating sets of legislative thinking that a national knowledge culture could invent. Can one even imagine a military scene in which a losing effort was fixed by reducing the number of soldiers available and then also giving them less training, ammunition and food? On the positive side, from a global perspective this set of policies has been invaluable in contributing to the rapid expansion of the international knowledge society.
Building curriculum around multiple coalescing categories of information and skills will remain especially challenging, though ISTE and the 21st century schools project have developed a wide range of guidelines that provide an effective place to begin. Other visualizations will follow, but to begin to see more viscerally the need to instructionally address this transformation in our information systems, spend a day at a nearby school and measure the amount of time learners access, communicate and process information digitally versus doing their work with paper. Note a key distinction in this comment, not what the teachers might be modeling with a computer projection system or smartboard or graphing calculator, but what the students in their classrooms are doing digitally to study, compose and think with over 94% of the world's information now in digital form. My observations would indicate that the majority of our public school students are generally living and learning within classrooms as if in the world of 1986 when paper was king and handled 99% of the world's information. Decades later they were left to work with and provide training for how to use just 6% of the world's information in 2007. They are forced to learn the old way, the 6% non-digital way, because the school systems are not funded to give them the tools of the new literacy. But at what cost do we cripple their future and our economy's future by not providing each student with 21st century digital information systems and the knowledge to use them wisely and effectively? What percent of higher education classrooms operate in a similar way? To what degree can such outdated classrooms prepare students for the current digital world (one that was well over 94% digital by the 2007), let alone the one that continues to advance years after 2007? What can teachers do to with what they have to prepare students for the future that surrounds them and yet is beyond their touch when in a classroom?
What should we measure and track to assist the forthcoming transformation in education and culture?
The current cultural and educational moment is then characterized by a small minority of citizens, educators and students with the knowledge of how to use almost unlimited educational and economic wealth for invention and profit. These citizens have available: prodigeous quantities and a rapidly changing quality of information; generally free tools for processing; free globally accessible communication tools to socially organize and share; a high percentage of jobs involved with some phase of knowledge management; and free spaces to store or publish knowledge projects and solutions to the world's challenges. If the vast majority of the world's citizens could use this information wealth to its capacity in real problem discovery and problem solving, this would hold incredible economic potential. The real concerns about former President Eisenhower's much quoted warnings about the industrial-military complex and the incentive for war and economically draining maintainance and expansion of military systems could dwindle to irrelevance. Such a change would allow even more wealth to move from non-productive to productive use, increasing the percentage of people that would be used in economically valuable ways within a global knowledge society that depends on collaboration.
Against this potent development and potential are an array of problems that create roadblocks for its advance and a growing tension between need and solution. The roadblocks are a series of information induced gaps that create serious challenges for society, educators and students in classrooms and at home needing to access, process and take entrepreneurial advantage of the world's current and incoming information.
The growth in just the number of files which serve as containers for all the data on the world's hard drives is growing faster then the growth in the quantity of information itself that these files contain. More importantly, while the growth of these files will increase by a factor of 75 by the year 2020, the pool of IT staff actually available to manage this growth will increase by a factor of 1.5 (Gantz & Reinsel, 2011^). This in turn has a huge and growing impact on operational costs that are needed to keep the data storage systems healthy (Stuhler, 2009^). This suggests a growing gap in our capacity to keep these files and their data safe and secure.
As the graph below shows, this management need is driven by a plummeting cost of information storage and a steady growth in the recognition of the value of this data.
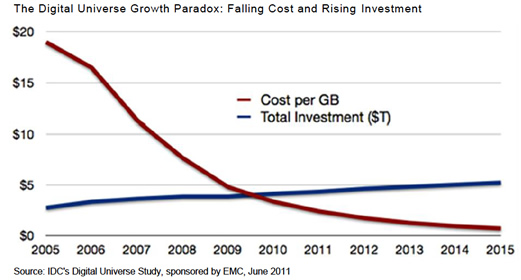
Data is money in the knowledge society. We are going to need more digital bank managers.
 Of the 17 sectors of business tracked in the United States, the McKinsey Global Institute reports 15 of them store more information per company than stored by the United States Library of Congress, which itself has a staff of several thousand ("Big Data", 2011^). If all of the data stored in 2007 were converted into paper and split into a separate library for every citizen on the planet, the space for each person would need to be converted into a library that contained 600,000 books, a structure 15 times bigger than a typical research university's library building (Hilbert, 2011^).
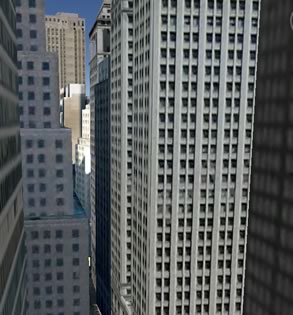
 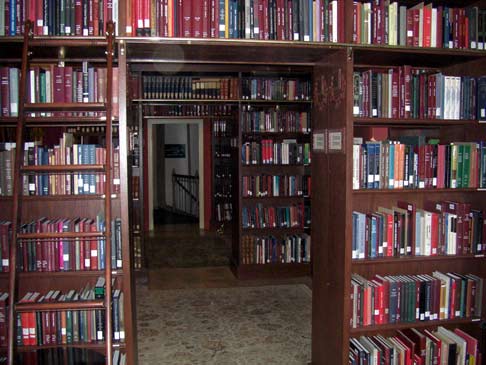 That is, a space inhabited by every citizen of the planet would need to become a skyscraper. This would make the entire surface of our planet as dense with skyscrapers as the 3D Google Earth image on the left. Every floor of those spaces would look like the photo on the right from the main reading room of the Library of Congress, filled with books. Next year 23% more space would be needed. This visualization could also be flipped into seeing our hard drives as a constantly expanding world of inverted digital skyscrapers of data happening as if growing underground like some kind of digital building fungus whose strands are growing deep into the Earth's crust.
In spite of the 23% annual growth in data storage that digital technology has enabled in the last 25 years, scientists have "recently passed the point where more data is being collected than we can physically store. This storage gap will widen rapidly in data-intensive fields" (Staff, 2011^). Given that growth rate, the amount of stored information was about 77 times greater in 2007 than in 1986. As a quick example of the problem, use your home or office and count the number of books and magazines, then multiply that number by 77 to imagine the growth of your collection in the years ahead. A modest collection of 100 books and magazines that kept pace with the data explosion after 1986 would have become 7,700 books in 2007.
One approach organizations are taking to lessen the cost of storage and increase access is to put the data "in the cloud", that is on the Net. As one example, North Carolina is using a portion of its $400 million dollar Race to the Top grant funding to create data storage systems for the needs of its K-12 classrooms and educators. The NC Education Cloud is part of Governor Bev Perdue's College and Career Ready, Set, Go! initiative that was officially announced on February 9, 2011.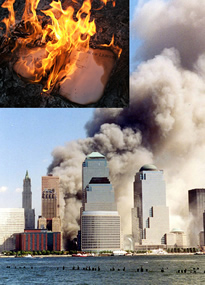
This storage gap problem goes far beyond the problem that scientists are having with the storage of research information and challenges us with a new number to comprehend. In 2007, the 1.9 zettabytes of data being broadcast per year was 6.5 times more information sent than the 295 exabytes of digital data being stored (Hilbert & Lopez, 2011^). A zettabyte is 1,000 exabytes which is a billion gigabytes or a trillion megabytes. That is, some 6/7 of what we see, read and hear every day is lost, not through malice or attack but destroyed through lack of place to put it and keep it for the long term. The collage of images on the right of a burning book and burning skyscrapers may be disturbing, but currently the unintentional consequence of annually losing millions of skyscrapers of data is information destruction on a planetary scale. How can we wisely discern what to save out of so much that is lost?
The race is on to see whether research into new data storage technology will ever produce a real product to close the gap between what is composed and communicated and what can be saved by a population racing to 8 billion people. Nanotechnology research already holds the promise of 20 fold improvement with potentially a thousand fold increase (Binnig et al, 2010^) while the qubit of quantum data storage promises much more (Busse, 2010^; Steiner et al, 2010^). Such future storage possibilities however are still deep in research and development, putting them a long way from ever appearing as a product.
There is a gap between the data being collected and the availability of people needed to analyze it and act on it. As a matter of educational policy, and considering just the data that is being stored not broadcast, there is a growing shortage of analytical minds that can keep up with and sift this explosion of data to comprehend its implications (Levy, 2009^; Staff, 2011^), let alone to find ways to explain it to others and apply it usefully to human and planetary improvement. Who has the time to read the 600,000 unique books of our own data-explosion library building? Note that everyone's library of 600,000 books will add 128,000 new books next year growing 23% larger every year thereafter. Consequently, we need far more students and citizens with the talent to use higher order thinking skills to effectively use the specialized information pouring into many fields.
In the field of information technology, this problem of extracting further value from large collections of data is known as "Big Data". Big Data is neither the created content, nor its consumption but its analysis. A part of this challenge is find and preserve the most valuable data amidst the flood of information that is both stored and cannot be stored. If big data is the equivalent of refining big oil, then our institutions of higher education should be among the major institutions that can frame themselves as the big refinery. Like oil, data must be "cracked" or refined into unique and useful elements. The results of that big data refining process however have a far greater value than oil. The non-rival nature of data also means that the same data (information oil) cannot be destroyed by use. Instead it can be reused in many different situations infinitely, multiplying its value many times over.
Of course, that reuse depends on those minds that know how to do this. The McKinsey Global Institute study puts the number of positions needed as double the number of personnel available by 2018 ("Big Data", 2011^).
Alex Szalay, an astrophysicist at Johns Hopkins University, notes that the proliferation of data is making them increasingly inaccessible. "How to make sense of all these data? People should be worried about how we train the next generation, not just of scientists, but people in government and industry," he says. ("Data", 2011^)
It would appear that the higher education refinery needs to get busy producing those who will do the refining. It is great to have bank accounts of almost infinite wealth, but it is far better to know how to make a withdrawal from the data banks that holds the wealth and use it to everyone's benefit. If we do so could we be within reach of the vision of Buckminster Fuller, one of the premier creative minds of the last one hundred years: "we now need only social comprehension and orderly social initiatives for turning on the valves of unlimited wealth for all humanity’ (Fuller, 1969, p. 73^)?
There is also a more general analysis gap, the capacity of a nation's citizens to measure and then comprehend information's impact that is occuring almost invisibly all around them. The Hilbert & Lopez study (2011^) covering the period from 1986 to 2007 was the most significant analysis of the world's capacity for information management to that date. Their article in Science is just one of a large set of articles in a special edition of the weekly journal titled Dealing with Data. Citizens are somewhat used to thinking about national budgets on the scale of trillions of dollars, but the language of petabytes, exabytes and zettabytes is beyond the vocabulary and experience of most citizens.
Reading text about numbers that are so beyond the scale of everyday human comprehension can be dense enough as to require many different perspectives that can be provided by using other media. The audio player icon below leads to a PBS radio broadcast interview with Hilbert. Click the image twice, once below and then the play button in the audio player on the new page that will appear from the Science site.

Below is the USC TV interview with Hilbert that was presented on the national cable TV network MSNBC.
It is critical to return to that staggering statistic, >94%.Well over 94% of the world's information was digital by 2007, and that quantity has continued to grow since. There is a giant multi-part gap between the weak digital composition and communication skills that most adults and students in K12 educational systems have and the range of information types representing the well over 94% digital nature of the current knowledge society. One part of the compositional gap is economic. The second is an instructional gap. It is an acute computer shortage issue in K12 and an instructional gap in the skills of both K12 and higher education instructors and professors. The third part of the composition gap is between the range of composition tools taught in our schools (to compose with the written word) and what the Web actually uses, which is everything. There has been an "explosion of new media technologies that make it possible for average consumers to archive, annotate, appropriate, and recirculate media content in powerful new ways" (Jenkins et al, 2009, p.8^). This is not just the technological knowledge of composition but also technology knowledge of searching within and for these types of new media. It is likely that the creative class identified by Florida (2002^, 2012^) is using their digital access and growing digital talent as the major factor in the rapidly growing economic power of this occupational class. Unfortunately there is a major gap between the media widely used on the Internet to process and exploit the data of the information explosion and the percentage of humans and school curriculum that uses that wide range of new media technologies.
The fourth part of this gap is in social skills instruction. Educational systems train our future thinkers, writers and problem solvers to primarily work solo while the work place and increasingly learning and communication depends on becoming part of social and problem solving networks. The potential for speakers of English is significant. The Internet World Stats site (2011^) reports that over 536 million Internet users, some 25% of the world's Internet using population uses the English language and only half of those users are in countries where English is the native language. Over 200 million, nearly half of the English Internet users, share a common account with Facebook. But through music and YouTube video, all Internet users can share forms of understanding and appreciation without speaking a common verbal language. This "may be the most radical element of new literacies: they enable collaboration and knowledge sharing with large-scale communities that may never interact in person" (Jenkin, 2009, p.33^). From the perspective of the social formation of the new media in the 21st century, the language arts curriculum is effectively fused with social studies objectives.
This explosion impacts the definition of literacy. Literacy is the capacity to understand and compose what goes on a page and digital technology has transformed the meaning of page, and what it means to create for the digital page in a globally and instantaneously networked age. "Literacy today depends on understanding the multiple media that make up our high-tech reality and developing the skills to use them effectively" (Jones-Kavalier & Flannigan, 2006^). Further, the current exponential nature of cultural and technical change means that the quadruple part nature of the digital composition gap has grown suddenly over the last 10 years.
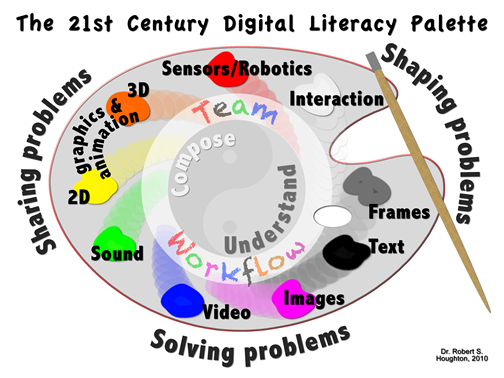 As digital technology could be used to express any broadcast and archived media, common standards have been established which have enabled any Web page or set of pages to combine a plethora of forms of information processing and expression. The idea of the digital palette on the right represents the range of options currently in widespread use for processing data on the Web. The new literacy can also be seen as ten literacies: frames, text, images, video, sound, 2D animation, 3D animation, sensor/robotics, interaction and team workflow. Only one of them, text, has a secure and expansive home in school curriculum. These tool categories are different kinds of processors for different media and different types of communication. They use the content of the data explosion to create new compositions for the arts, humanities and sciences that aid the digestion, recombination and communication of new ideas. These tools are used to feed on the questions and problems emerging from the data explosion. For example, if ideas needed to be expressed as change over time, such as the data explosion, a composer might need a 2D animation application, and would need to know to find and know how to use Adobe's Flash animation program which dominates the expression of animation on the Web.
There is also a lost child in this digital transformation, or perhaps the better metaphor would be the invisible 800 pound gorilla in the room. The scarcity of software developers is already significant and having a major impact in slowing the advance and the effectiveness of business practices (Rao, 2011^). If knowledge is the new oil, computer science knowledge builds its refineries, its tools and the cultural software compositions that are actively in use. Should there be any doubt about the ubiquity and cultural integration of software, at the writing of this paragraph, Apple had just announced that its App Store had just reached the level of 25 billion downloads of hundreds of thousands of software titles for just a segment of the digital devices currently being sold (Murphy, 2012^). Not to say that they are direct equivalents, but in comparison, book sales in 2011 were around 15.5 billion dollars and showed no growth over a many year period (Rosenthal, 2011^) in a well defined, understood and mature market. The software sales for just Apple's digital segment of the market grew have increased at the rate of more than 15 billion a year for the last two years in a market of display devices that did not exist 3 years ago and is still developing. If those App Stores titles sold on average for $2.00, and we speculate that books did not sell on average for as low as $2.00, the software market is much larger than the book market (Rosenthal) in both quantity of titles sold and economic value. Does our instruction of children match the current and future direction of our cultural practices? Where in the education of our citizens have our K-16 school systems placed anything like the current emphasis on learning to compose sentences with the ability to compose a subroutine in a computer program?
Where in the digital palette categories should our educational curriculum place programming (e.g., software development, computer science) and when should it be introduced in school curriculum? In terms of the digital palette it clearly began as a specialized form of textual thinking but there are also visual programming languages that move images around to stand for the flow of a computer program. Is it a new form of text literacy and should be taught in language arts? Given its fundamental role in the application of sensors and robotics is science a better fit? Does its requirements for logic and numbers put it in mathematics? Does anyone doubt that teachers in these content area are totally unprepared to deliver such instruction? Teacher education programs have largely ignored and have yet to grapple at all with the challenges of the new literacies (Larson & Marsh, 2005^), let alone the highly relevant yet absent conversation about software programming. There are many excellent resources for teaching programming from the elementary grades upward in ways that develop higher level thinking and profound intellectual growth. Seymour Papert has not only been making this argument persistently since the publishing of the highly cited Mindstorms (1980^) but has worked diligently and effectively to create the curriculum tools and resources to facilitate such an advance. As teacher education programs are charged to prepare teachers for delivering the state curriculum requirements, and state curriculums have also failed to grapple with this wide ranging new literacy, it is unlikely that the subject of software will be forced into light in the near future. What percentage of state curriculums require any, let alone significant instruction in computer science at elementary, middle and high school? Where will the leadership come from to lead the development of the necessary and significant educational and cultural changes?
The cultural implication is rather significant. The challenge of mixing and using all of the software paint of the digital palette on the 21st century canvas/easel of the World Wide Web is huge. The digital palette has plunged most of the once comfortably educated citizens and leaders of the world into various degrees of functional illiteracy. But again, it is more than focusing on the skills of the digital palette. Meeting the full challenge of the digital palette means crossing a new gap as wide as the gap between oral and written culture. That oral-written culture gap is still significant; at the same time that text literate citizens are reaching for effective digital literacy, the illiterate and functionally illiterate in written text, some 25-50% of the citizens of the United States, still cannot effectively read and write, that is use just the color black (text) on the digital palette ("Reading, Literacy", 2011^).
As just one highly visible example of the impact both classic literacy and digital literacy, consider the invention of a system now annually worth multi-trillions of dollars to the global economy (McKinsey Report, 2011^), the Net. The Internet and later the World Wide Web are the products of higher education and government research labs, a highly literate percentage of the population. Taken further, what is the significance to the nation's and the world's economy and culture of each one percent of its citizens that can actually cross the digital gap and fully use the digital palette? Can those without this digital knowledge lead others across the new gap?
While this expansion of literacy has enabled a smaller percentage of the more privileged population to communicate using a wide spectrum of media perspectives that include many free composition tools, the vast majority of citizens and school curriculums have made little contribution to composing across this gigantic leap in the definition of 21st century literacy. Those educators that have sought to lead their students by developing curriculum in this regard find that they need professional development and added digital resources. These goals are further challenged by print focused assessments systems that are out of date with the new reality of the Web's digital literacy (Tan & Guo, 2009^).
The problem goes far beyond the classroom to the scholars whose scholarly journal articles promote change and innovation in the field. Though many scholarly journals have moved to sharing their content via the Web, their publications are still primarily text documents that have not chosen to integrate the new media of expression. In the case of the noteworthy open-access, online and free collection of the PLoS (Public Library of Science) journal movement, audio and video are encouraged, but kept in a supplemental area, external to the presentation of the text as with the PLOS publications.
The problem is not really about the difficulty of learning these new forms of communication. At the same time that journals and journal authors are not producing multiple media compositions, the ease of use in the basic creation of all of the media of the digital palette are within the ability of a wide range of elementary school students. That includes those in primary grades who cannot yet read and write. Perhaps in that fact is a new solution to the gap in understanding and composing created by the challenges of text literacy.
Of special interest to education is the growing gap between the one way and two way systems of communication. The primary grist for classroom teachers are the traditionally valued systems of publishing (the formats of book, newspaper and journal that have been around for centuries) and to a tiny extent, television and radio (that came to dominate communication in the 20th century but were not economically feasible to teach until the digital age). The use of these one-way forms of communication has become a relatively flat 6% annual growth rate in comparison with the 28% annual growth of bidirectional telecommunication (e.g., telephone, smartphone, computers and the Internet) (Hilbert & Lopez). This could be read as creating almost 5 times the need for students to spend time improving their skills with two-way systems of communication using the full range of the tools of the digital palette than with the management and use of paper technology. How will public education cope?
What is needed next is a study of the percentage of time school students spend with and in the study of managing information in paper systems and time spent with digital systems. Because of the lack of computers on student desks, the simple conjecture is that the vast majority of a student's American school classroom time is spent in paper based systems, which would indicate a massive misalignment with global, and in particular, United States of America economic reality. Public school funding is so constricted for digital technnology that the primary instructional tools currently available to schools, books and note paper, are for a world that began rapidly disappearing for adults in the actively growing part of the economy over 25 years ago.
This is not to say that the current efforts of schools are hopeless. Foundational skills are needed as much as ever, but so much more is needed. However, implementing best practices in thinking and problem solving can play critical roles in prepare minds for the digital transition. For example, if schools put an accent on questioning and higher order thinking skills, students will at least have foundational skills with real relevance for encountering the digital world as it happens.
There are two significant 'access gap' problems. The first gap is the lack of simple access to hardware (phones, computers and the Net), what might be thought of as access to the digital tool chest. Awareness and initial exposure generally depend on sufficient income. The second access gap is access to the knowledge of how to use personal computing devices to access, process and communicate information. The gap is also a lack of knowledge of how to use digital and other information systems to organize with others to form problem solving teams that can lead to entrepreneurial developments. Much of this information is available for free once sufficient education is provided in how to look for and use it. Though a general cultural problem, this is an especially acute problem in K-12 education and still a substantial problem even in well-endowed university environments due not to lack of technology but lack of instruction as previously noted in the discussion of the communication gap.
The end result of both these gaps is an increasingly inequitable culture of rapidly growing but lower paying service jobs and the high unemployment caused by the decline of manufacturing positions. This is in contrast to the growing wealth and low unemployment of the creative class. The social-economic process causing the rise in inequality has been called "skill-based technical change". As technology (computer hardware) has continued to drop its price or double its capacity at roughly the same price every two years (e.g., Moore's Law), the price of everything built from it from computers to cameras has benefited. This accelerated the transformation to the digital information technology revolution. "In the last three decades, the rental price of skilled labor has soared dramatically relatively to that of unskilled labor despite a major uprise in the relative supply of skills" from institutions of higher education (Violente, 2008). Why? There are three interlocking explanations. Skilled labor makes better use of digital equipment which has pushed up the competition for skilled labor increasing their wages. Digitally educated people make good innovators with digital information and systems, so digital education speeds the spread of technical information and skill development. This in turn enables these workers to adapt more quickly to the rapidly changing nature of technology itself. Third, reduced costs of data storage, composition, communication and team management made it possible to invent new more cost-effective organizations if sufficiently skilled labor was available (Autor, 2003^; Violante, 2008^) which further drives up wage demand.
This skill-based technical change "has shaped the huge rise in wage inequality which in turn underpins a broader set of social, cultural, geographic, income and other inequalities" (Florida, 2012, p.359^). Those digitally-skill-based move to areas where their skills are in higher demand while those without move to areas with low paying service sector jobs and better paying but declining factory jobs creating geographic distortions in the distribution of wealth. Lack of access creates an "iron curtain" across the path of those in poverty and the current trend of job migrations is leading to the development of low wealth and high wealth regions. Low wealth communities are less inclined to invest more in public schools that would enable the digital access problem to begin to be solved with the children in poverty.
Access Gap to Basic Computer Technology and 21st centuryKnowledge of its Use
The first access gap problem is getting access to an information technology device such as a personal computer and learning its most basic 21st century skills. 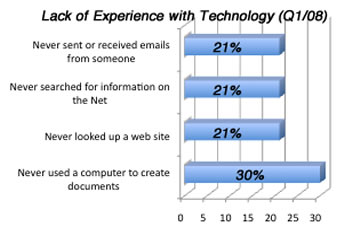 Even within the number one economy of planet Earth, one survey (see graph on right) showed that 21%, about one-fifth of all heads of households in America, "have never used email...; nearly one out of three household heads (30%) has never used a computer to create a document" and the same 21% had never looked up a website or searched for information on the Internet according to the director of research at Park Associates (Barrett, 2008^). At a time in which well over 94% of the world's information is in digital format, with many students having limited home exposure, schools still cannot provide sufficient computer use. Further, they still lack the educators with sufficient digital skill to address the range of composition and processing skills of the digital palette for a world of information that may be at 99% digital saturation when their students graduate from high school. One consequence of the funding formula for education is that students in most K-12 schools are forced to practice their classroom information management around the 1986 information technology available to schools, the paper, book and magazine based school system built at a time when 99% of the world's information was in analog formats such as paper and videotape.
In the developing world, around 4/5 of these citizens do not have Net access, though it should be noted that in the United Nations 2010 telecommunications report that over 57% now have cell phone access, a doubling of access in just 4 years ("Measuring", 2010^). It is from those with cell phone access in the developing world that we get a measure of how important access to even limited information and communication technology can become. "“Mobiles have spawned a wealth of micro-enterprises, offering work to people with little education and few resources” ("Measuring"). As one example, in both India and Haiti millions that had been without bank accounts now make deposits, withdrawals and money transfers through their cell phones. "Cell phones are one of the most effective advancements in history to lift people out of poverty" (Clinton, 2012, p. 40^).
The contrast with higher education that works with the best students in the country is curious and implies that having great access to computers without digital literacy standards and significant professional development could mean much more than it does. Higher education has been heavily endowed with significant access to digital technology, especially for students in the last fifteen years; one reaches the same conclusions about hallway observations in higher education as in K12 schools. Research is needed into the percent of college and university classroom activity that is as digitally centered and intensive as the world has become and is becoming. The author's personal observation over this time period have indicated that digitally intensive classrooms even here are still rare but growing. This might imply something about the how the rate of growth of digital information systems has surprised even post-secondary education. It also might imply something about the depth of skills needed for fluent 21st century digital literacy, which are complex and rich with options, as every bit as significant and complex as learning to read has been for our K-3 population.
Access Gap to the Net
The second access gap problem is not just about access to basic computer technology, but access to the information broadcast over the Web and the capacity to share and broadcast information initiating with the individual. That a third of the planet is currently using the Internet to access and process the swelling treasure trove of information is a measure of its power and usefulness. In the United States, over 1/3 do not have access to Internet broadband speeds and some 10% have access to services that are so slow that they do not support basic online uses such as downloading Web pages and photos (National Broadband Report, NTIA, 2011^). The shrinking size and portability of access technology through mobile smartphones and other technology are leading to a dropping cost of access. These are positive signs that the rapid growth in Net users will continue. Among American college students, 10 percent used a handheld device to get on the Internet every day in 2008,a figure that mushroomed to over 50 percent in 2010 (Keller, 2011^).
These developments have created a secondary effect of lack of access. The advantages of regular Net access are so valuable in terms of economic efficiency, personal liberation and social decision making that the "haves" have put forces in motion that are accelerating them away from the "have nots". High speed social and political developments and decisions occur on and through the Web in which the have-nots cannot participate. In a democracy it is always a major ethical problem when a substantial portion of the population has a comparatively significant disadvantage in terms of their access to information and its forms of communication.
The Flash animation on the left is of the 1961 construction of the Berlin Wall being built through the heart of the German city of Berlin with armed guards on alert. It highlights both sad and celebratory chapters in human history and another example of an important element of the digital palette.
This animation draws attention to both the wall's beginning and its end two years after President Reagan's 1987 speech with its famous quote. This scene and the historical events that followed reminds us of an intentional "abuse of power" policy to restrict freedom in order to maintain the personal power and information control of a dictator. This had immense negative implications for the physical and economic health, knowledge and freedom of those citizens behind the wall. The fall of the Berlin wall also had significant information age importance. Friedmann's book The World is Flat (2005^) and multiple updates since 2005 point to the 1989 fall of the wall as a key accelerating point in the history of the world and the information age. The fall of communism liberated huge populations of people hungry to use modems, personal computers and the Internet for global study and communication, a development that merged with rising economic standards that brought in citizens from India and China, which further significantly accelerated the growth of information and related tools. More recently, instead of citizens becoming freed to use more information, the world witnessed in the spring of 2011 the use of the information systems in the Middle East to liberate entire countries, Egypt and Tunisia.
In a very real sense the digital divide has become the new Iron Curtain of the age, contrasting slow personal growth and stagnating economic development on one side with rapid improvements in the quality of life on the other. The "Digital Iron Curtain" is perhaps the most significant information gap of many, one more unintentional consequence of the explosion of information, but one that enlightened citizens in democracies and our votes can quickly change. Given the global need for analysis and application of the exabytes of information being collected and the zettabytes being transmitted, the inability of any and every citizen on the planet to participate and assist in the roles of knowledge analyzing and creating is a significant loss. On the other hand, the positive values created by demolishing the digital iron curtain through it's easy access by everyone could be even more richly rewarding both socially and economically to the world than the implications of the fall of the Berlin Wall.
Solutions to the Access Gap Problem
A number of innovative solutions to these two access gap problems have continued to emerge over time. These solutions come at the problem from two directions, political legislation enabling all citizens and school policies impacting all school children.
It is government legislation that has created the concept of the world's newest liberation zone, the newest "free world", the Net free zone, which has become the newest expansion of the definition of human rights. Finland (Pictet, 2010^) is the first country to pass legislation declaring that a fully functional information society means that Net access is a legal right provided freely to any citizens that cannot afford it. Japan, South Korea and Sweden are close to such goals. British national policies are moving in this direction. The British program titled Race Online 2012, has provided cheap refurbished PCs with subsidized Net connections seeking to "make the UK the first nation in the world where everyone can use the Web" (HM Government, 2011^). A recent step taken by the U.S. government in this direction was the creation of a Web site, http://www.digitalliteracy.gov/ in May of 2011. On May 16, 2011, a Special Rapporteur to the Human Rights Council of the United Nations was commissioned to create a report that will serve as the basis for further discussion on the role of the Internet. The report's author declared: "Given that the Internet has become an indispensable tool for realizing a range of human rights, combating inequality, and accelerating development and human progress, ensuring universal access to the Internet should be a priority for all states" (La Rue, 2011^).
Schools policies have been dependent on a wide variety of funding sources. The first major corporate "seeding" was the 1985 to 1995 Apple Classrooms of Tomorrow (ACOT) research project that provided computers to explore the learning impact of computers, a wide range of related technology and professional development that were available to all students and teachers for use at home and at school (Keefe & Zucker, 2003^; Sandholtz et al, 1997^). The first major government initiative, one still expanding, is the 2002 Maine Learning Technology Initiative (MLTI) in the United States to provide professional support and laptops to all 7th and 8th grade students and their teachers, a program extended to Maine high schools in 2009. Less extensive but still impactful approaches have included the state of North Carolina's effort to provide all state schools with high speed Internet access to all classrooms and numerous "cloud computing" resources through the Web for 2011-2012. A private initiative spun out of Massachesetts Institute of Technology (MIT) and spear-headed by Nicholas Negroponte was the One Laptop Per Child goal to design, manufacture and support a very cheap ($75 to $100 (US) ) computer which began shipping over 1 million computers to 3rd world countries in 2008. The first national level directive came in July of 2011 from South Korea which announced its plan to replace all paper textbooks and curriculum materials for all K-12 students with digital material on tablet computers by 2015 (Rooney, 2011^).
These highlights to progress in universal computer access in education show a steady progression from basic product marketing to ever larger levels of social integration. At the same time, the results of existing universal computing initiatives implies that schools need much greater structural change in school practices in order for computers to make any significant educational difference in existing measures student achievement. Mere access to computers is insufficient (Weston & Bain, 2010^). New measures of student achievement that address the new digital economy and knowledge explosion are just appearing. For example, the OECD PISA test of online skills across some 16 different member countries of OECD identified South Korea as having the highest skill levels among the 15 year-olds tested in navigating and evaluating information online (PISA, 2009^), a tiny fraction of the knowledge represented by the digital palette discussed above under "Composition Gap".
Sudden change creates a gap between the reality of new data and our psychological capacity to absorb and change our behavior to fit the new situation. This might be called the response gap. The feeling of disorientation and dislocation are classic symptoms of various degrees of cultural and physical shock. A wide range of "first responder" systems designed to help put people back on their feet again have been designed for many well known and frequently experienced catastrophes. The agricultural age (accident, flood, fire, crime, war) developed insurance and specialized teams of people on standby from the Red Cross to the fire department. The finanical age (job loss, business closing, bank failure) created various forms of federal, state and company short term funding. Those are highly visible phenomena. In contrast, the data explosion of the information age is an invisible wave of intellectual energy. The shock of the information tsnumani and related information needs strikes differently than rapid physical change. A flood of information is simultaneously an analysis crisis and an opportunity for new developments, for what the business community refers to as entrepreneurship and Shumpeter's sense of creative destruction.
The culture's response system to lack of knowledge or the wrong knowledge is education. The need for education travels at the outer edge of the data explosion. But the major systems of education in place still base their calendars and the vast majority of their course offerings off a calendar based on the agricultural age, and on curriculum activities that are often interpreted as irrelevant to the course participants, and that's for well known and established problems and topics. This problem and suggested way out are presented in a richly visual and aural way in the video of Michael Wesch's TEDx lecture below titled From Knowledgeable to Knowledge-Able.
Unlike our older cultural designs for emergencies (fire, police, ambulances, etc.), our education system and in particular our university system have not developed a first responder model that can come into play 24/7 when an information crisis comes into play. For example, job loss is an information crisis in addition to being a financial crisis. It is more likely that the person will need retraining and educating for a new and different job, not another version of the one they left. One could claim that the Web provides precisely that, but it is clearly ad hoc and an unorganized approach that can be difficult to apply for both small and larger problems. Until better Web applications are designed for all the different scales of problems, we are left with the existing educational system. It may be months after an information crisis occurs in the life of a person before a university or college may have openings for course offerings, if course offerings exist to address the problem. Much remains to be conceptualized and invented for the impact of rapid waves of data which undergird changes in many forms of power.
The hard evidence of data's exponential growth (Hilbert & Lopez) and the numerous gaps that have formed have also suggested something even more significant. The distance, the gap, between what we want and knowledge of how to get there, the capacity to predict and control our personal and cultural future in some thoughtful reflective 'planned in advance' way, is growing. The control gap occurs at many levels.
The problem is fundamental even at the level of our language. The information arena is crowded with attempts at such verbal control: information society, third wave, post-modern, the knowledge economy, network society, cyberspace and more. There is a widespread description of a new culture that is emerging, one that is emerging from a new digital literacy, but labeling and understanding it in a way that enables some sense of understanding and control is a continuing challenge.
The control gap is both personal and cultural. Long prior to the major scientific discovery of chaos theory in the 1960's and 70's and its idea that interactive systems diverge exponentially with time was a social idea of unpredictability, the frontier, a zone largely beyond society's and culture's power of legal, cultural and economic control. The historian Frederick Jackson Turner used the data of the U.S. 1890 census to declare in an 1893 essay that the frontier was dead, finished in the 1880's with the westward expansion of sufficient people. The essay was later the first chapter of his 1921 Pulitzer prize winner, The Frontier in American History. While his great insight was the impact of the frontier and its mobile westward moving citizens in forging American character, he was not able to also see that the data collecting system on which he was dependent was the seed of something else. That he had census data in 1891 to analyze was because of a data collecting punch-card company that later became IBM (International Business Machines). Herman Hollerith's Tabulating Machine Company was hired in 1890 because of the knowledge explosion of census data for the 1880 census. The country's growing population had created so much information in 1880 that government officials could see that the 1890 census was in danger of not being completed within the time limit, a report required by Federal law every ten years.
Since that early entrepreneurial event, the emerging IBM then pioneered the development and analysis of the explosion of information through the 20th century. By the 21st century, the digital and social systems created around IBM's vision of greater control of data for decision making, accelerated beyond anyone's capacity to keep up with the data. The death of one frontier was the birth of the next. Today we are more inclined to speak of entrepreneurs instead of pioneers but the concept and the needed skill set are the same. The information explosion provides vast opportunity and value in developing the talent in individuals for questioning, for opportunity recognition, for taking qualified risk, and for inventing the solutions that will be valued by others. The knowledgeable are increasingly scarce, valuable, and mobile in regards to geographic location (Birkinshaw, 2005^), and using mobile communication tools.
There are claims that one of the negative residues of "frontier mentality" (Chiras, 2010, p. 543^) was a blatant disregard for the ecological consequences of human actions. That is, the bounty of the land seemed so endless that the land was farmed and hunted until depleted; people moved on to work the next forested area and the cycle repeated itself. The ethic of sustainability is promoted as an antidote to that frame of mind. As this new digital frontier is forming and being recognized, can an appropriate ethic and psychology for the new knowledge frontier also be seen?
It may be better to see that the vast and animated growth of changing data means that the hope of long term and highly predictable control is misplaced and in vain. The newest frontier has burst into life in our midst like some spontaneous astronomical black hole and as a virtual entity grows exponentially faster than our capacity to contain it. The data explosion may have surprised us with its extent and intensity, but this can be seen as an opportunity for a new range of questions about how to make the most of a new and growing frontier. Though Turner may have failed in noting all the negative consequences of frontier thinking, he did successfully note that the challenges of the constant newness of a frontier forged a resourceful new generation of people whose well honed skills promoted great individual and then great social confidence. Turner saw in this individualism an anti-social or anti-government perspective but at the same time noted egalitarian and collaborative practices that were essential to frontier success and the creation of a new consolidated identity forged from many nationalities and languages. "The frontier is the line of most rapid and effective Americanization. ...(W)e note that the frontier promoted the formation of a composite nationality for the American people" (Turner, 1893^).
As the American frontier line shifted ever westward over the centuries, each westward region posed different challenges forcing pioneers to change to fit the changing characteristics of setting. The digital frontier already shows that pioneering characteristics which Turner once thought uniquely American are deeply human characteristics now playing well across a digital frontier. This new frontier is drawing immigrants from across the globe into cyberspace and into successful encounters with its maelstrom of data (Friedmann, 2005^) and into pockets of unparalleled creativity (Florida, 2002^, 2005a^, 2005b^, 2008^, 2010^). Turner observed that "(t)he economic and social characteristics of the frontier worked against sectionalism" creating a feedback loop that impacted even the "civilized" or settled regions of society. In the same way, the economic and social characteristics of a Net based knowledge society work against global sectionalism and towards egalitarian and local and global problem solving. The American frontier mentality and American spirit was developed over three hundred years of pioneering. Earth's frontier mentality in cyberspace with the mobile millennials now populating it is still beginning. Within the world's global online activity similar seeds of egalitarian and collaborative progress can be seen.
The knowledge society's distinguishing feature in the long term may not be its technology or its gargantuan trove of data but this frontier characteristic, a frontier the likes of which has not been seen and not been engagable before by so many citizens. It is being rapidly populated by the "knowmads" of the mobile (Birkinshaw, 2005^) millennial generation capable of working anywhere, anytime with anyone (Moravec, 2008^). Instead of gradually shrinking, the digital frontier seems ordained to provide its pioneers with the "manifest destiny" of limitless expansion as well as constant change. Its unlimited wealth of data invites everyone to be entrepreneurial and creative pioneers in mining its opportunities. Knowmads are innovation dependent in the sense that their careers depend on discovery and further innovating with their discoveries amidst the avalanche of data in order to stay afloat. Society must then ask to what degree its schools are innovation dependent, and graduating students that are ready and capable in growing with and in an innovation dependent culture.
The Common Core curriculum that is emerging as a national agenda (and debate) puts high value on Bloom's taxonomy of higher order thinking, essential questioning practices for discovering and mining the mindboggling sea of information opportunity. Discovery of how effective your local schools are in such practices would require a visit to nearby classrooms to determine for yourself what progress is being made in integrating the questioning skills and the digital tools necessary for effective 21st century schools.
Rapid change in the growing availability of data creates wide ranging opportunities and challenges. The Web economy can be seen as a positive sign, an entity that has emerged by feeding on this data explosion and mining those gaps. This entity will provide increasing opportunity for jobs and entrepreneurship for those that are prepared. A seemingly inevitable consequence of such exponential change may be the creation of numerous and significant gaps between what is new and our personal and cultural capacity to respond. Going forward may require the development of a "science of gaps" just to address it. This also creates wide ranging opportunity for research into how best to address these gaps.
This creates a major challenge in preparedness. Schools and educational systems have represented our focused cultural capacity to address changing knowledge. Within this setting, K-12 schools and educational systems can be likened to a rubberband, with one end of the band attached to the year 1986 and the other end of the rubberband grabbed by the Web economy of the 21st century and pulled rapidly away, adding great tension to the stretch. Our world's curriculum requirements and hence our instructional objectives are then also largely attached to 1986 ways of thinking while the 21st century creates tremendous and growing pressure for new curriculum requirements and new instructional objectives. At the moment, tension is still building. At some point it seems likely that the school rubberband will become unattached to 1986 and all of it will spring into the 21st century with a suddenness that may not be pleasant for many that would be forced into quick adjustments. Such a situation would further imply poor application of digital ideas for years to follow. An even more dangerous possibility might be a snapping of the rubberband in the middle in which most public schools are forced by economics to stay with largely 1986 resources while better funded students jump to better endowed private schools leaping into 21st century thinking. Something dramatic will be needed to address and resolve the growing degree of tension that the gaps of the age of knowledge are creating.
This knowledge society will put ever greater pressure on current employees and organizations to keep up with rapidly changing knowledge requirements. This will require a constant examination of the kinds of learning required to keep resumes current. It also calls for a similar and intense examination of the kind of K-12 and higher education curriculum this requires to prepare children and all citizens for our future cultural needs. But how we frame the problem enables us to tackle it or not, to surf the tsunamis or not. The continuing improvements in technology and its dropping cost provide hope for inclusive policies that will enable all to shift from surviving to thriving in the new age. We can hope to surf the exponential waves, to learn the new literacy of the full range of the digital palette, to teach how to ride the surges of the information explosion with élan. We can do so today at a level sufficient to teach those who follow us and will master it. That is a pioneering role for which teachers of all age groups in all countries of the world are well suited.
It may turn out that the knowledge society is not a glittering city on the hill but instead a collection of growing and turbulent frontier outposts inhabited by somewhat scruffy, yet capable data surfers, 'knowmads' living on the edge of the future.
Anderson, C. (2012). Makers: The New Industrial Revolution. Cornerstone Digital.
Andreessen, M. (2011,August 20). Why Software Is Eating The World. Wall Street Journal. http://online.wsj.com/article/SB10001424053111903480904576512250915629460.html
Autor, D., Levy, F. , & Murnane, R. . (2003). The skill content of recent technical change: An empirical exploration. Quarterly Journal of Economics, 118, 1279-1334.
Babbage, C. (1832). On the economy of machinery and manufactures. London: Charles Knight. Google Books link to publication.
Barrett, J. (2008). 21% of Heads of Household Don't Use Email, Internet. Retrieved July 25, 2008 from http://www.marketingvox.com/21-of-us-heads-of-household-dont-use-email-internet-038765/
Be more competitive by nurturing big data (2013). ClearCI. http://www.clearci.com/new-infographic/
Big Data: The Next Frontier for innovation, competition and productivity. (2011, May). McKinsey Global Institute. http://www.mckinsey.com/mgi/publications/big_data/pdfs/MGI_big_data_full_report.pdf
Binnig, G. K.; Cherubini, G. ; Despont, M.; Dürig, Urs T. ; Eleftheriou, E.; Pozidi, H. & Vettiger, P.(2010). The Millipede – A Nanotechnology-Based AFM Data-Storage System. Springer Handbook of Nanotechnology, Part G, 1601-1632, DOI: 10.1007/978-3-642-02525-9_45. Retrieved February 25, 2011 from http://www.springerlink.com/content/x64378823626715n/abstract/
Birkinshaw, J. (2005). Knowledge moves. Business Strategy Review, 16: 38–41. doi: 10.1111/j.0955-6419.2005.00378.x
Brand, S. (2007). A series of information explosions: Summary of presentation by author Alex Wright. http://longnow.org/seminars/02007/aug/17/glut-mastering-information-though-the-ages/#
Building with big data: The data revolution is changing the landscape of business. (2011, May 26). The Economist Magazine. http://www.economist.com/node/18741392?story_id=18741392&fsrc=rss
Bush, V. (1945, July). As we may think. Atlantic Monthly. http://www.theatlantic.com/magazine/archive/1945/07/as-we-may-think/303881/
Busse, T. (2010, February). Itty bitty qubits: The next big thing in computers. Wisconsin Engineer. Retrieved February 27, 2011 from http://www.wisconsinengineer.com/articles/106
Castells, M. (2000). End of Millennium: The Information Age: Economy, Society, and Culture Volume III (Information Age Series). Wiley-Blackwell.
Castells, M. (2010). End of Millennium: The Information Age: Economy, Society, and Culture Volume III (Information Age Series). Wiley-Blackwell.
Chiras, D. D. (2010). Environmental Science, eighth edition. Sudbury, MA: Jones & Bartlett Publishers.
Clinton, B. (2012). The case for optimism. Time Magazine, 37-44.
Data, data everywhere. (2011, February). The Economist. http://www.economist.com/node/15557443
Davidson, C. (2011, January 18). This is your brain on the Internet: Syllabus, contract, schedule. http://www.hastac.org/blogs/cathy-davidson/your-brain-internet-syllabus-contract-schedule
Drucker, P. (1969) The Age of Discontinuity. London: Heinemann.
Drucker, P. (1993). Post-Capitalist Society. New York: Harper Business.
Finn, H. (2011). Lunch with Hal: Hal Varian, Chief Economist at Google, sinks his teeth into data obesity and how to treat it. Retrieved March 23, 2011 from http://thinkquarterly.co.uk/01-data/lunch-with-hal/
Florida, R. (2002). The Rise of the Creative Class. And How It's Transforming Work, Leisure and Everyday Life. New York: Basic Books.
Florida, R. (2005a). The Flight of the Creative Class. The New Global Competition for Talent. HarperBusiness, HarperCollins.
Florida, R. (2005b). Cities and the Creative Class. Routledge.
Florida, R. (2008). Who's Your City?: How the Creative Economy Is Making Where You Live the Most Important Decision of Your Life. Basic Books.
Florida, R. (2010). The Great Reset: How New Ways of Living and Working Drive Post-Crash Prosperity. New York: HarperCollins.
Florida, R. (2011). The Rise of the Creative Class, Since 1800. http://smartregion.org/2011/03/creative-class-revisited/
Florida, R. (2012). The Rise of the Creative Class-Revisited. New York: Basic Books.
Gantz, J. & Reinsel, D. (2011, June). Extracting Value from Chaos: Fifth annual report on the digital universe. IDC corporation report. http://idcdocserv.com/1142
Garnham, N. (2001). Information Society Theory as Ideology: A Critique, Studies in Communication
Sciences 1, 129–66.
Garnham, N. (2004). Information Society Theory as Ideology. In Frank Webster (Ed.) Information Technology and Society Reader. London: Routledge.
Gershenfeld, N. (2005). Fab: The coming revolution on your desktop--from personal computers to personal fabrication. Basic Books.
Gladwell, J. B. (1999). The Immensity of Technology . . . and the Role of the Individual. International Journal of Technology and Design Education, 9(3), 241–267. www.eric.ed.gov/ERICWebPortal/recordDetail?accno=EJ601955
Guo, W. & Kraines, S. B. (2009). Cross-language knowledge sharing model based on ontologies and logical inference. In S. Chu (Ed.), Managing Knowledge for Global and Collaborative Innovations. (pp. 207-220). London, England: World Scientific Publishing.
Hilbert, M. & López, P. (2011, February 10). The World's Technological Capacity to Store, Communicate, and Compute Information. Science. DOI: 10.1126/science.1200970. Retrieved February 11, 2011 from http://www.sciencemag.org/content/early/2011/02/09/science.1200970
HM Government (2011). About Race Online 2012 and Our Vision. Retrieved February 8, 2011 from http://raceonline2012.org/about-us
Houghton, R. S. (2011a). Foundations for Educational Planning: Major Trends of the Fourth Age of Computing. Retrieved from http://www.wcu.edu/ceap/houghton/EDELCompEduc/Ch1/technology_trends.html
Houghton, R. S. (2011b). Designs of the Digital Magic Wand: The Three Parts of a Computer. http://www.wcu.edu/ceap/houghton/readings/computer_design.html
IDC (2012). IDC Predictions 2012: Competing for 2020. http://www.idc.com/getdoc.jsp?containerId=231720
Internet Matters: The Net's sweeping impact on growth, jobs, and prosperity. (2011, May). The McKinsey Global Institute. http://www.eg8forum.com/fr/documents/actualites/McKinsey_and_Company-internet_matters.pdf
Internet World Stats (2011). http://www.internetworldstats.com/stats.htm
Jenkins, J.; with Purushotma, R.; Weigel, M. Clinton, K. & Robison, A.J. (2009). Confronting the challenges of participatory culture: Media education for the 21st century. Cambridge, MA: MIT Press. Retrieved from http://digitallearning.macfound.org/atf/cf/%7B7E45C7E0-A3E0-4B89-AC9C-E807E1B0AE4E%7D/JENKINS_WHITE_PAPER.PDF
Johnson, D. W.; Johnson, R. T. (1994). Learning Together and Alone. Cooperative, Competitive, and Individualistic Learning. Fourth Edition. Allyn and Bacon: Needham Heights, MA.
Jones-Kavalier, B. R. & Flannigan, S. L. (2006). Connecting the Digital Dots: Literacy of the 21st Century. EDUCAUSE Quarterly. 29(2). http://www.educause.edu/EDUCAUSE+Quarterly/EDUCAUSEQuarterlyMagazineVolum/ConnectingtheDigitalDotsLitera/157395
Keefe, D. & Zucker, A (2003, April). Ubiquitous Computing Projects: A Brief History. Ubiquitous Computing Evaluation Consortium, SRI International, http://ubiqcomputing.org/Overview.pdf
Keller, J. (2011, January 28). As the Web goes mobile, colleges fail to keep up. The Chronicle of Higher Education, 57(21), A1,A12-14.
Kirkpatrick, D. (2011, November 30). Now Every Company Is A Software Company. Forbes. http://www.forbes.com/sites/techonomy/2011/11/30/now-every-company-is-a-software-company/
La Rue, F. (2011, May 16). Report of the Special Rapporteur on the promotion and protection of the right to freedom of opinion and expression. http://www2.ohchr.org/english/bodies/hrcouncil/docs/17session/A.HRC.17.27_en.pdfhttp://www2.ohchr.org/english/bodies/hrcouncil/docs/17session/A.HRC.17.27_en.pdf
Larson, J. & Marsh, J. (2005). Making literacy real: theories and practices for learning and teaching. London: SAGE.
Levy, S. (2009, June). The secrets of Googlenomics. Wired. 109-115.
Lipson, H., & Kurman, M. (2013). Fabricated: The New World of 3D Printing. Wiley.
Machlup. F. (1962). The production and distribution of knowledge in the United States. Princeton, N.J.: Princeton University Press.
McDougall, P. (2012, July 24). Microsoft Tops H-1B Visa Employer List Software and tech services companies dominate the 25 biggest corporate users of the labor-import program. InformationWeek, http://www.informationweek.com/global-cio/outsourcing/microsoft-tops-h-1b-visa-employer-list/240004231
Measuring the Information Society: Executive Summary. (2010). International Telecommunications Union. The United Nations. http://www.itu.int/newsroom/press_releases/2010/pdf/PR08_ExecSum.pdf
Papert, S. (1980). Mindstorms: Children, computers, and powerful ideas. Basic Books, Inc..
Moravec, J. (2008). Knowmads in Society 3.0. Education Futures. Retrieved from www.educationfutures.com/2008/11/20/knowmads-in-society-30/.
Murphy, D. (2012, March 3). Apple's App Store Hits 25 Billion Downloads: How Many Per iPhone? PC Magazine. http://www.pcmag.com/article2/0,2817,2401122,00.asp
NTIA. (2011, February). Digital Nation: Expanding Internet Usage. United States Department of Commerce. Retrieved February 19, 2011 from http://www.ntia.doc.gov/reports/2011/NTIA_Internet_Use_Report_February_2011.pdf
Oxford, T. (2011, May 26). Internet of Things: how it will change the world. http://www.techradar.com/news/world-of-tech/internet-of-things-how-it-will-change-the-world-958669
Pictet, C. (2010). Internet Access Now a Legal Right in Finland. TechHaze. http://techhaze.com/2010/07/internet-access-now-a-legal-right-in-finland/
PISA (2009). Students On Line: Digital Technologies and Performance. http://www.pisa.oecd.org/document/57/0,3746,en_32252351_46584327_48265529_1_1_1_1,00.html
Postman, N. (1992). Technology: The Surrender of Culture to Technolog. New York: Vintage Books.
Proffitt, B. (2012, November 12). Peta, Exa, Yotta And Beyond: Big Data Reaches Cosmic Proportions. http://readwrite.com/2012/11/23/peta-exa-yotta-and-beyond-big-data-reaches-cosmic-proportions-infographic
Rifkin, J. (2014). The Zero Marginal Cost Society. New York: Palgrave Macmillan.
Rao, V. (2011, December 5). The Rise of Developeronomics. Forbes. http://www.forbes.com/sites/venkateshrao/2011/12/05/the-rise-of-developeronomics
Reading, Literacy & Education Statistics (2011). The Literacy Company. http://www.readfaster.com/education_stats.asp#literacystatistics
Rooney, B. (2011, July 5). South Korean Schools To Be Digital By 2015. Wall Street Journal. http://blogs.wsj.com/tech-europe/2011/07/05/s-korean-schools-to-be-digital-by-2015/
Rosenthal, M. (2011). Book Sales Statistics. Forner Books. http://www.fonerbooks.com/booksale.htm
Sandholtz, J.H. et al. (1997). Teaching with Technology: Creating Student-Centered Classrooms. New York, New York: Teachers College Press, Teachers College. ERIC Document Reproduction Service No. ED402923.
Saporito, B. (2013, May 09). Blood Work. Time Magazine, Business 1-4.
Savitz, E. (2012, May 30). Cisco Predicts The Rise Of The Zettabyte Era. Forbes. http://www.forbes.com/sites/ericsavitz/2012/05/30/cisco-predicts-the-rise-of-the-zettabyte-era/
Shapiro, C. & Varian, H.R. (1998). Information Rules: A Strategic Guide to the Network Economy. Watertown, MA: Harvard Business Press.Shirky, C. (2009). Here comes everybody: The Power of Organizing Without Organizations. New York, NY: Penguin.
Shirky, C. (2010). Cognitive Surplus: Creativity and Generosity in a Connected Age. New York, NY: Penguin.
Slavin, R. E. (1980, Summer). Cooperative Learning. Review of Educational Research, 50(2), 315-342.
Slavin, R. E. (1983). Cooperative learning. New York, New York: Longman.
Staff of Science (2011, February 11). Introduction to special issue: Challenges and opportunities. 331(6018), 692-693. DOI: 10.1126/science.331.6018.692.
Steiner, M. ; Neumann, P. ; Beck, J. ; Jelezko, F. & Wrachtrup, J. (2010). Universal enhancement of the optical readout fidelity of single electron spins at nitrogen-vacancy centers in diamond, Phys. Rev. B 81, 035205 Retrieved February 26, 2011 from http://physics.aps.org/pdf/10.1103/PhysRevB.81.035205.pdf
Stuhler, J. (2009, January 22). Managing the data explosion. IT Director. Retrieved July 25, 2011 from http://www.it-director.com/technology/data_mgmt/content.php?cid=11025
Tapscott, D. & Williams, A. D. (2007). Wikinomics. Portfolio Penguin.
Tapscott, D. & Williams, A. D. (2010). MacroWikinomics: Rebooting business and the world. Portfolio Penguin.
Toffler, A. (1965, Summer). The Future as a Way of Life. Horizon, VI( 3).
Toffler, A. & Toffler, H. (1970). Future Shock. New York: Random House.
Toffler, A. & Toffler, H. (1980). The Third Wave. New York: Random House.
Toffler, A. & Toffler, H. (1990). Powershift: Knowledge, Wealth and Violence at the Edge of the 21st Century . New York: Bantam Books.
Toffler, A. & Toffler, H. (2006). Revolutionary Wealth. New York: Knopf.
Tan, T. & Guo, L. (2009/2010). From Print to Critical Multimedia Literacy: One Teacher's Foray Into New Literacies Practices. Journal of Adolescent & Adult Literacy 53(4), 315–324. http://www.reading.org/Publish.aspx?page=/publications/journals/jaal/v53/i4/abstracts/jaal-53-4-tan.html&mode=redirect
The location of data is changing: The storage effect. (2013). Seagate Market Research & Competitive Intelligence. http://storageeffect.media.seagate.com/2012/09/storage-effect/chart-the-location-of-data-is-changing/
Tsay, M., & Brady, M. (2010). A case study of cooperative learning and communication pedagogy: Does working in teams make a difference? Journal of the Scholarship of Teaching and Learning, 10(2), 78 – 89.
Turner, F. J. (1893). The Significance of the frontier in American history. http://xroads.virginia.edu/~HYPER/TURNER/chapter1.html
Turner, F.J. (1921). The Frontier in American History. New York: Holt.
Turner, V. (2014). The digital universe of opportunities. IDC. http://www.emc.com/leadership/digital-universe/2014iview/digital-universe-of-opportunities-vernon-turner.htm
Tyler, RW. (1965). The Knowledge Explosion: Implications for Secondary Education. Educational Forum, 29(2), 145.
Tynan D. (2010, Aug 6). Google: Brace Yourselves for the Data Explosion. ITworld.http://www.pcworld.com/article/202723/google_brace_yourselves_for_the_data_explosion.html
Vasseur, J.P. & Dunkels, A. (2010). Interconnecting smart objects with IP: The next Internet. Burlington, MA: Morgan Kaufmann.
Violante, G. (2008). Skill-Biased Technical Change. In S. N. Durlauf & L. E. Blume (Eds.), The New Palgrave Dictionary of Economics, 2nd edition. New York, New York: Palgrave Macmillan. http://www.econ.nyu.edu/user/violante/Books/sbtc_january16.pdf
Webster, F. (2002). Theories of the information society, second edition. London, Britain: Routledge.
Wilson, A. (2010). Knowledge Power: Interdisciplinary Education for a Complex World. Oxford, UK: Routledge.
Wesch, M. (2010). From Knowledgeable to Knowledge-Able. TEDx, http://youtu.be/LeaAHv4UTI8
Weston, M. E. & Bain, A. (2010, January). The End of Techno-Critique: The Naked Truth about1:1 Laptop Initiatives and Educational Change. The Journal of Technology, Learning, and Assessment, Spe ial Edition: Educational Outcomes & Research from 1:1 Computing Settings, 9(6), http://ejournals.bc.edu/ojs/index.php/jtla/article/view/1611/1458
Wright, A. (2007). Glut: Mastering Information Through the Ages. Washington, D.C : Joseph Henry Press.
Wurman, R. S. (1997). Information Architects. New York, NY: Graphis Inc.
Yudkowsky, E. S. (2001). Future Shock Levels. Retrieved February 25, 2011 from http://sl4.org/shocklevels.html.
Original - February 14, 2011 - Updated April 19, 2014| Version 2.73 - Author: Houghton