|
|
Sensors & Remote Control Composition |
|
Image courtesy of LANL. |
|
|
Sensors & Remote Control Composition |
|
Image courtesy of LANL. |
Electronic design, e-design, refers to a new form of composition that emerged in the late twentieth century. This is the art and science of planning, designing and creating with electronic devices. An increasingly important aspect of that design is the inclusion of sensors. "The impact of sensors will be as surprising in the decade ahead as microprocessors were in the 1980's and lasers were in the 1990's" (Saffo, 2002). The ability to compose with such ideas and tools is not yet common public knowledge like knowing how to compose with words, but much is happening to prepare for more widespread 21st century use. This chapter addresses current sensor development, the broad nature of sensor use and their growing application, examples of creating sensor systems and integrating sensors into Web multimedia compositions for use in classroom activity.
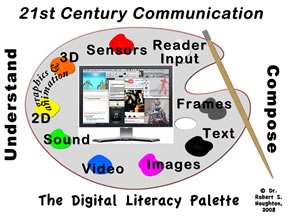 Sensors are one of the fundamental elements of the digital palette (clickable image on the right) for 21st century composition. As school curriculum continues to put an emphasis on
authentic data collection and primary source material, educators will find ready application for such
technology. The growing interest in curriculum for STEM (Science, Technology, Engineering, and Math) agendas will further drive interest is this knowledge. The arts also use sensors extensively from museum displays to dance troupes. Sensors are used in all manner of ways in engineered compositions that are a part of routine every day life in the 21st century. The current automobile, for example, is a rolling bathtub of sensor systems
that report the status of brakes, tire pressure, engine temperature, fuel
input, cruise control, security, or make emergency reports when occupants are
disabled after a crash.
Sensors are one of the fundamental elements of the digital palette (clickable image on the right) for 21st century composition. As school curriculum continues to put an emphasis on
authentic data collection and primary source material, educators will find ready application for such
technology. The growing interest in curriculum for STEM (Science, Technology, Engineering, and Math) agendas will further drive interest is this knowledge. The arts also use sensors extensively from museum displays to dance troupes. Sensors are used in all manner of ways in engineered compositions that are a part of routine every day life in the 21st century. The current automobile, for example, is a rolling bathtub of sensor systems
that report the status of brakes, tire pressure, engine temperature, fuel
input, cruise control, security, or make emergency reports when occupants are
disabled after a crash.
At its most basic a sensor is a mechanical or electronic device that detects a signal or stimulus for the purpose of some response. The opening window on the right (or refresh the global and zoomable Pachube view) shows the location of sensors colored coded by different categories that have been made publically available from around the globe. Zooming in to various locales by clicking the plus sign shows that vast spans of our continents are not providing any sensor data yet. However, the Internet of Things with its smart objects (e.g., tiny Net connected computer sensor compositions embedded within the object) that will be emerging in the years ahead will create a dense carpet of sensor data from the 3,000 to 5,000 objects that surround each of us every day.
If all this sounds a bit distancing, approach it from a personal level with the sensor that almost all of us have outside our home. The thermometer is often found outside many kitchen windows. It ommunicates the temperature visually when those inside observe the alignment of the mercury in tube with the number printed alongside it. However, it requires a human being to respond to the data to make something happen. Different types of clothes go on or off depending on that simple measurement.
This concept becomes more interesting and useful when humans can compose a sensor system that automatically takes care of something. If the temperature rises above 90 degrees and the humidity in the soil drops below 55% and the light level measurement indicates bright direct sunlight, then quickly turn on the water drip to plants in house windows 1, 3 and 7. If plant soil humidity is more than 75%, then stop watering. Digital technology will allow 24/7 access to our things from any location.
Such concepts are foundational for the sciences. Using a pencil to periodically observe and record data on a piece of paper at some regular interval is the fundamental building block of all science, observation. Using the recorded data from the sensor to determine how to set those an action point differently for different kinds of plants is experimental science. Digital sensor technology will radically empower our capacity to do both.
One key advantage of the digital age is the capacity to not only measure some condition and respond to it automatically, but to also automatically store that data which is then considered by mathematical formulas that analyze the data and then send an email with summaries of the analysis for later human decision, including editing the mathematical formulas. Building such systems involves integrating engineering knowledge with mathematics, science and technology. Sensors can be connected with remote control devices and sometimes used in combinations of mechanical technology which form a variety of robotic systems. Sensors have widespread applicability as they parallel the sensing capabilities of the human body, such as sight, sound, taste, smell and touch. Even more interesting are the many kinds of sensors that go far beyond the body's sensing capacity, such as the ability to "see" in the dark with infrared sensors that detect heat or the ability to "taste" the acidity of chemical combinations in places where it is not wise to stick one's tongue, instead using pH sensors embedded in boiling liquids.
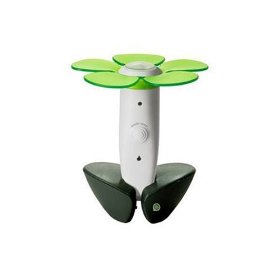
The sensor is just one element, though a key element, in many digital creations. If the temperature rises above 78 degrees then other technologies must transmit the signal to devices that turn on the fan and open the door. These designs or electronic compositions include wires, switches, transmitters and sensors. The design might also include computer chips and mechanical parts that include gears and motors. Combine enough of these components together, and a robot is born. Once standards are set for attaching sensors of a particular size, designers could quickly construct a wide range of basic sensing systems much like children assemble Lego bricks. In fact, as Lego has been among the early adopters of sensor technology in their products, such as the widely popular Lego Robotics Kit. Their developments hints at the future of sensor compositions.
Rapidly dropping prices, sizes and increasing capacities also hint at enormous changes that will be coming as electronic composers use these new systems in their designs (Hardy, September, 2003; for more, see Dust, Inc). Complete sensor units combined with a CPU, data storage and medium range wireless input and output are rapidly shrinking towards the size of a grain of sand, approximately 1 mm on a side, and are predicted to sell for around a dollar. Units currently the size of a 9 volt battery were sold in 2007 in the $50 to $100 range. With very low power consumption designed to last for many years, the wireless signal range of a single unit ranges from slightly longer than the length of a football field (100 yards) to a mile or more. Because such units will self-organize, passing information in bucket-brigade style from one sensor to the next, then quickly shutting down to save power, a handful of such units could cover many square miles for years. What remains to be seen how soon an easy to use plug-and-play market will develop which does not require an in-depth programming or engineering background for basic design work. Predictions about the future of sensor development are relatively clear about size. Sensors will continue to get smaller. Nanotechnology points in the direction of even smaller systems, sensor systems the size of dust particles. Smith and Nagel's review of nanotechnology-enabled sensors (November, 2003) provided an early review of where current research was heading.
Though sensors can report their data through wired and wireless design, the market for them not only lacks universal standards for easy connectability, like a 110 wall plug for electrical systems, but the sensors themselves do not have standards for their immediate connection to the global Internet. Current sensor nets use a variety of network protocols. That is, sensors do not come with the built-in technology to have Internet Protocol numbers, or IP#s for short.
Standards for sensor Net use will be changing rapidly. Daily Channel News (Ho, 2008) reported on the observations of one of sensor movement's leaders. "We've been working on IP in smart objects for two years and when we started to look at these kind of networks, there was a plethora of proprietary protocols and a lack of standardized protocols of where I can use IP in smart objects," said Jean-Philippe Vasseur, distinguished engineer at Cisco and chairman of the IPSO Alliance's Technical Advisory Board."
The Internet Engineering Task Force (IETF) announced technical guidelines in the summer of 2009 that give a sensor its own unique Web location, enabling the data from any sensor to be just as accessible and referenceable as any document or media composition that has a current Web address (Meritt, 2008a^). The Internet Protocol for Smart Objects Alliance (IPSO) (2009^) announced in the spring of 2009 that they had "successfully demonstrated interoperability with standards-based IP networks and Internet test servers", sensors and several varieties of wireless communication (Yahoo! Finance, 2009^). The chair of the IPSO Alliance, Geoff Mulligan, notes that wireless Internet technology can be put in an under $2.00 device (Meritt, 2008b^). Market analysts predict that current trends will have a major impact in the near future. "By year end 2012, physical sensors will create 20 percent of non-video internet traffic" (Gartner, 2009).
The implications are endless, from the mundane to the educationally serious. Can't find your toothbrush? Need water temperature data from a sensor in the stream behind your school? A search of this emerging Internet of Things may report a device's current location and any data a sensor embedded within it might be reporting in real time. Given past history with the current Web and the immediate value of sensor data, it is possible that Internet based sensor use will have as stratospheric an impact on culture as has the growth of the Web to date. There are many examples of widespread use of sensor compositions.
Though a number of examples of sensor use will be provided below, they represent but a tiny tip of the iceberg of the different types of sensors and their uses. With rare exceptions, many of the example sensors have limited communication ability. They generally report their data to the individual device to which they are attached, such as a water sprinkler, food release for a pet, room temperature controller, calculator or computer. The trend though has been to connect sensors with internal power supplies and wireless communication capacity to ever larger networks, sensor nets. Making sense of massive quantities of data creates a number of difficulties in understanding, that is reading the data. As sensor systems become integrated with the Internet, graphics and charts showing patterns are being integrated into web pages and positioned next to text and other media with further explanation. To better understand the role of sensors, a wide variety of uses need to be explored, including international, national, regional and personal roles.
International
The Pachube site noted earlier represents the most recent development in growing array sensor data from individual contributers from around the world. Other sensor projects are massive in concept and design, and require funding from multiple countries, projects that have been underway for many years. Concerns over global warming and the lack of real time data from about 2/3 of the planet have led to the creation of Argos.  "Argo is a global array of 3,000 free-drifting profiling floats that measures the temperature and salinity of the upper 2000 meters of the ocean. This allows, for the first time, continuous monitoring of the temperature, salinity, and velocity of the upper ocean, with all data being relayed and made publicly available within hours after collection" (UCSD, 2009), usually 12 to 24 hours later.
 The picture on the left of a man holding an Argo float give a sense of its size. Clicking the schematic of the float shows an explanation Argos sensor package's inner mechanisms.
  Each black dot on map to the left shows only the position of these floating sensor platforms, not providing any summary of the data they are reporting.
The map on of black dots on the left is showing just those sensors located in the Atlantic Ocean off the East coast of the United States on April 14, 2009.
To see the global view of the sensors on this same date click the map itself or these links for the medium and big scale maps.
The actual current map is freely available at the University of California-San Diego site and more information is available through the international JCOMM site. The YouTube videoclip on the right describes the deployment, functions, diving and communication capacity and purpose of the Argo sensors.
Each black dot on map to the left shows only the position of these floating sensor platforms, not providing any summary of the data they are reporting.
The map on of black dots on the left is showing just those sensors located in the Atlantic Ocean off the East coast of the United States on April 14, 2009.
To see the global view of the sensors on this same date click the map itself or these links for the medium and big scale maps.
The actual current map is freely available at the University of California-San Diego site and more information is available through the international JCOMM site. The YouTube videoclip on the right describes the deployment, functions, diving and communication capacity and purpose of the Argo sensors.
A related sensor project has to do with the Carbon Explorers, based on SOLO floats (Sounding Oceanographic Lagrangian Observers) (Preuss, 2001). Global warming is in part the result of more and more carbon entering the atmosphere. SOLO is a floating sensor station (Preuss, 2004) equipped with instruments for measuring organic and inorganic carbon, both in solution and tied up in particles. Some 3,000 of these carbon sensor systems will be placed afloat in oceans around the world, measuring and beaming their data back to satellites for years at a time. These same sensors are also being placed in tiny remote controlled submarines that are programmed to leave and return to harbors and be redirected by satellites, collecting not only data but actual samples of biomass for more detailed analysis.
National
 The United States maintains a land based sensor network on its streams for weather prediction services. In contrast to the Argos map above, the more sophisticated and clickable map on the right shows not only location, but a graphic representation of at least hourly real time stream sensor data in dots of colors that represent the amount of rainfall. The colors scale from red to lowest and black at the highest. A mere glance at the map provides a quick understanding of water availability across the nation. The National Water Information System site maintains this click and zoom-in map of the states where a click on the dot leads to detailed data from each individual sensor station (click the map or link) from each dot. Each sensor station is a collection of a dozen or so kinds of sensors that also includes stream depth and speed.
 Some regional sensor visions are not realized on a regional scale but become but larger national projects. The Neptune Project was conceptualized as an under-water observatory area off the coast of state of Washington. (Credit: Image Courtesy Of University Of Victoria, Neptune Project) It has more recently been expanded as a national project to create under-water observatories off both coasts. As the YouTube videoclip of the Ocean Obsevatories Initiative (OOI) notes, this will mean that not only scientists but any user of the Internet will have continuous access to the sensors including cameras that will be in place. The OOI Web site notes that this will mean that ocean scientists which have historically been required to get aboard ocean going vessels for short periods of observation will transform their science through continuous 24/7 data collection.
Regional Uses
Periodically, various large-scale construction projects generate significant interest. In 2001, the Department of Transportation placed webcams (light sensor) near the site where a bridge, the U.S. 82 Greenville Bridge, was being built across the Mississippi River near Greenville, Arkansas. A pull down menu let viewers of the bridge project's web site switch between several other webcam views of the construction area during its construction and completion. The webcams have been removed since the completion of the bridge structure over the water in 2006 but the web site has numerous pictures, some taken with the webcams, and a multitude of multimedia elements spawned by the still ongoing construction project.
Totally unrelated to the bridge construction project, the USGS (United States Geological Survey) Department uses a variety of sensors to measure the flow of the Mississippi River. Where the webcam looked at the top of the river, there is another observation system with sensors under the water in the same location. The live incoming data is used to create a running graph of incoming data of water depth over an seven/eight day period. See http://waterdata.usgs.gov/nwis/uv/?site_no=07265455 and scroll down for the graphed data. Note the pull-down menus near the top of the page that lead to different ways to see the graph and other types of data reporting. For example, by selecting "Water Quality" from the pull-down menu, data from some 12 other sensors appears, including temperature, pH and nitrate counts. This data is not graphed by the Web site itself, but through daily collection, could easily be entered into a spreadsheet and turned into different kinds of graphs for further analysis.
A second example is also a combination of webcams set up by one agency for one purpose and sets of sensors set up by other agencies for different purposes. The challenge is to recognize and find some combinations. A live webcam of a lock 25 on the Mississippi River can be combined with USGS water data from a nearby point on the river, to gain a more comprehensive understanding of the river, its flood stages and the impact on people working and using the river area. These two separate scrollable web pages were also combined in a frameset pair to show both pages at the same time to facilitate comparing what is seen visually with what hidden sensors are reporting. The top frame can be scrolled to show a recent live image and the bottom frame to show real time sensor data and graphs.
A third  example is the massive and thorough sensor system set up in the James Reserve in California. This grid of observation devices includes a number of webcams of bird feeders and ground locations with many other kinds of sensors. Though this data is reported out at their web site, it has also been integrated with downloadable files for Google Earth that enable live data reporting while viewed from a three-dimensional map (see picture on right). It is important to scroll down this web page to find and download the Google Earth files, run them and explore this multimedia integration in the Google Earth application with their data reporting network. This is an excellent example of how digital systems can be used to support the fundamental role of observation in science and the value of mathematics in reaching higher levels of thinking and understanding.
Personal, Classroom, School and City Uses
Gardening, medical and home monitoring uses are just some of more personal uses of sensors that K-12 students are most likely to encounter. Numerous technologies and companies provide technology for these areas. There are many more areas of more personal sensor use of which students have little awareness.
 One basic example for classroom use comes from EasyBloom. If EasyBloom's plant sensor is pushed into the soil around a plant, its sensors collect light and water data and store it on a Flash chip embedded in the device. After the device has collected data for 24 hours, it is connected via a USB cable to a computer. The data is uploaded to their Web site and analyzed against national U.S.A. data about local growing zones, climate and hourly weather, then recommendations are made about treatment of a plant to improve its growth. The site will also sift through a Web database of over 5,000 U.S. plants and recommend what plants would also grow under similar conditions as plant being studied. It provides data as well on how to how to care for them. An online videoclip at EasyBloom's Web site provides a clear overview of the process. Their online database of plants though can be used by anyone, whether an owner of their products or not.
The transmission of personal medical data has evolved with whatever telecommunication system has been in place. In the 1960's the U.S. astronaut program (Bashshur & Lovett, 1977) was using what was then called telemedicine technology to transmit physiological parameters of those orbiting the earth to ground based medical monitoring services. In the summer of 2009, Carol Kasyjanski became the first U.S. patient that used wi-fi technology and the Internet to make at least daily reports of her pacemaker to a heart monitor system that analyzed vital heart signs and automatically notified her physician of real or potential concerns. Dozens of types of physical data can be monitored with such systems, such as high blood pressure and glucose levels (Gruber, 2009).
Home monitoring systems report data from a wide variety of devices to home owners and security monitoring companies. The data might be reported using a home base station with alarm sounds or using phone and Internet systems to the owner who is away from the house. Moisture or water sensors can report that clogged pipes have backed water up into basements or spilled onto carpets and even activate controllers that turn off the water main to the house. Other basic uses include sensors for: temperature that drops below a preset level; leaking toilets; motion detectors that report on toddlers or elderly family members that move around at night into areas where they should not be; tilt sensors reporting that garage or house doors or jewelry box lids are being opened; appliances such as stoves or coffee-makers left on when they should be off, or TV sets turned on when folks should be asleep; and sump pumps or wells turning on at unexpected times. Webcams also report live video views of both outside and inside the house to secure Web pages.
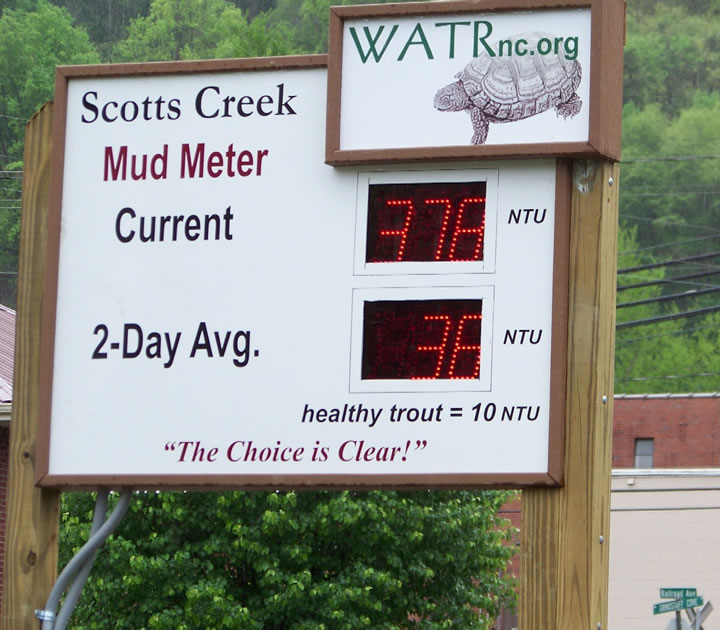 Sensor projects may often start out without any connection to the Internet and then with community help could expand to many other real-time forms of data collection. The Mud Meter in Sylva, North Carolina does not report data to a web page but to a public sign readily visible to those driving by. Clicking the image will reveal a clearer view of the sign while the Tuckasegee Watershed web site provides more information on this community group's goals and activities. Making this same data available on a web page further expands the number of possible observers and increase their sensitivity to construction and other human activities that add mud to the river and harm the health of the trout and stream, which detracts from the fishing experience of those who would drive to the region, visitors that would help build the local economy by spending money while in the area. Adding a webcam to show the color of the river combined with USGS survey data from nearby data collection points would further extend the understanding of what is happening, especially during a rain event.
Each kind of sensor gives different perspectives of an area or an issue. It is the educator's challenge to integrate this sensor capacity into required content areas. For example, the information from the Mud Meter sensor system and others discussed here are made to order for social studies and biology competencies that inquire into the impact of society on itself and nature and its many biological systems. Sensor information is equally valuable for mathematics classes that need authentic data and real world context from which to teach mathematic procedures for carrying out deeper levels of analysis. This types of information resources can be localized for almost every classroom situation. Nearly every stream in the United States has USGS sensor systems on it, which can be found from the national and state maps at the USGS site. For a more detailed view of this development, explore the Greenville Bridge Composition. which combines USGS sensor data with media from multiple sources.
Data from a sensor must not be thought of only in mathematical and scientific terms. Combining live interaction with humanly recognizable output, artistic work of great aesthetic quality can be produced. Proximity sensors provide just such an example. Their function is to measure the distance between two objects. They can be found in both analog and digital formats. One of their uses is to help set safety limits in the use of different kinds of machines. The proximity sensor is linked to other devices so that the physical measurement might be reported as a needle on a dial, text on a computer screen, or as a musical pitch to indicate the height, depth or closeness of an object. An audio or musical pitch is useful if visually reading a display is not possible or dangerously distracting at times, such as for a pilot or driver.
As an example of the creative relationship between science and art, early research into proximity sensors and the sensor feedback of this data as an audio signal, led to the idea of electronic music and the invention of the first instrument that did not require physical touch, the theremin. Note the hand position in relationship to the antennae in the picture of the theremin. It is named after its Russian inventor Lev Sergeivitch Termen, who later changed his name to Leon Theremin. Once musicians learn the hand manipulation skills around the proximity sensor antennae, serious music can be performed. Peter Pringle has provided several examples of his theremin performances with this instrument that must be heard to understand the depth to which human creativity has taken this concept.
David Waxman's video demonstration of some rock music with a digital theremin-like device called the Solo Frame, shows some of the versatility of the concept. The Reach sensor ($100) extends this idea to almost any object that someone might reach for and then interact with, for example a plant, a flower vase, water fountain, sculpture or dancers. Variations on the theremin instrument have been heard in settings as diverse as the Beach Boys band, Hollywood movie music scores, and symphonic concerts. Though not widely known, instruments are still being built and groups still gather to share performances. For example, a group of theremin musicians planned the first Ether Music 2005 theremin music festival in Asheville, North Carolina on August 4-7, 2005, a festival that continues into the present.
The dancer in the videoclip on the left used an i-Cube-X sensor system. The i-Cube-X is one example of a a family of products used in many of these situations. Making human action the primary source of the sensor data has led to the use of sensors in museum displays and live dance performances.Some sensors measure muscle response, some proximity. This in turn is fed to MIDI devices which can activate other kinds of media. A YouTube search for i-Cube-X will turn up a number of examples of how this technology works.
Other concepts in art have yet to be extended to integrate the thinking of digital sensors. For example, Alexander Calder's mobile sculptures are designing to sense air currents and move the hanging art sculpture in interesting and artistic ways. What new forms of art might be created sensing something other than air through the use of digital sensors and move in response to it?
Options for sensor use also address more personal needs. In many cases, data is collected by devices hooked to a calculator or portable computer and used by a person in the field. Then the sensor and its supporting technology is brought back to the lab and this data is hand carried to a computer and inserted for further analysis. Increasingly however, the sensor stays in the field. Using wires or wireless technology the remote sensor device somewhere on earth or within the solar system is controlled and observed from a professional's office or by you and your students sitting in your classroom. An excellent example of this thinking is the Spot Satellite Personal Tracker that can read the world's GPS signals to record someone's position every few minutes. This continuously transmitting GPS position might be used to report a need for help or simply to report the location data so that friends can track your progress on a map for fun.
Classrooms
Schools have found that handheld devices from handheld computers to calculators can have probes (sensors) attached that collect data, and the calculators in turn can connect to a desktop Mac or Windows computer system and uploads the data for further analysis and exploration. For example, one can dip the temperature probe in a stream at different times of day and use the data to create a graph from which to discuss the changes.
Handheld Calculators and sensors have been used to build curriculum for CBL (Calculator Based labs). Teachers are also assisting with this curriclum development, such as PhysLab, a teacher developed integration of this CBL technology at the High School level. The Globe Project uses CBL equipment to carry out part of its data collection. Fairview School in Jackson County, North Carolina and others in our area participate in this project. The GLOBE Program is a hands-on science and education program that unites students, teachers, and scientists from around the world in study and research about the dynamics of the Earth's environment. Hundreds of thousands of GLOBE students in over 8000 schools in more than 85 countries have taken part i important environmental measurements and reporting their data for use by scientists. The GLOBE Program is implemented through a worldwide network of primary and secondary schools. GLOBE students: take environmental measurements at or near their schools; report their data through the Internet to the GLOBE data archive, create maps and graphs to analyze GLOBE data sets, and collaborate with scientists and other GLOBE students around the world.
Curriculum materials and sensor equipment can be also obtained from many sources that can be operated independently as data loggers or connected to laptop, desktop, touchpad computers and smartphones. This would include educationally focused sensor product companies such as Vernier, Data Harvest, Pasco, Texas Instruments, Fourier and the Lego's robotics lines. This would also include interesting vendors such as Sensorex, Global Water, Emerson, Vegetronix and numerous others. Many companies use palmtop devices to handle test and measurement situations in the field and in the classroom. Sensor Magazine's Handheld Instruments - The Shirt-Pocket Revolution provides a useful overview of sensor development for highly portable equipment. Even cell phone designers find them useful, as in the iPhone 3G's two proximity detectors along with an ambient light sensor on its face and an accelerometer sensor on the inside.
The WeDo kits from Lego for primary and elementary grades have provided a highly accessible approach to understanding sensors and their actual and potential interconnectedness with other content areas and the world around. See the clip below.
Their Lego Robotics kits for 4th grade and up have led to widespread state, national and international competing teams using robot/sensors designs and these kits.
A growing list of other applications of sensor technology relevant to educational activities needs some review and exploration of how they might be discussed and used in school curriculum. New interesting additions are always welcome. The wide range and integration of sensors with the Internet also raises some deeper topics, such as the Gaia hypothesis and the Internet's role in extending it.
Prior chapters have used the structure of input, manipulation and output to address many types of composition. Before heading into the less well known territory of designing with sensors and electronic components, let's review the familiar ground of the writer, the creator of text compositions. When writing with text, the composer is concerned with having a vision or concept of what he wants to accomplish. This is more complex than it sounds, because it requires a fair amount of experience in reading the text compositions of others so that one has models for where one might want to go or where one might want to diverge from past designs. This applies equally to all the other forms of composition that have been explored so far. Many educators cannot build a digital device, but deep exposure to what is possible with sensors puts them in a position to have an idea that leads to someone else doing the assembly funded by venture capital or grants.
In order to envision possible electronic compositions, one needs prior models. A number of possibilities have been explored. When it comes time to compose and build, other questions need answering. How many categories of sensors are available? Where does one get the sensors? How does one connect the sensors to other useful technology? What is the range of possibilities that fall within educational application and curriculum development?
Most sensor use is a complete package that only needs power from a battery or wall plug. Other designs need to be connected to a computer or some kind of device and comes with supporting software. Most multimedia projects use sensor data from someone else's sensor that is reporting information to the Web. Unlike the previously discussed categories, this period of history is just at the beginning of having software which can support the creation of a plug and play sensor based composition by a novice with minimal training.
As the prior examples have indicated, the skills to compose with sensors have produced an explosion of applications for art, math and science, educational administration, business and other content areas. The composition process begins with finding a sensor. It's assembly general requires other parts including wires, solder and some programming and electrical design knowledge.
The web site http://www.findasensor.com/ provides quick categorized sets of sensors for almost every conceivable application. What do you want to measure or manage today? Google's image database provides a view of thousands of sensors currently being used in the marketplace. (Find the start menu in the top frame and see the link to Google: Sensors.) Sensors Magazine provides a SpecSearch with a comprehensive set of sensor categories and related chip sets. Browsing this forest of options is an education in itself. For more consumer oriented products aimed directly at schools, two major directions have been taken: calculator based and hand-held computer based. Most sensors that connect to calculators and hand-held computers are also available for desktop computers. Texas Instrument maintains their Data Collection Product Center which highlights their decade of experience in connecting school curriculum with calculators and sensors. The web site of Vernier Software and Technology reviews a wide range of sensors connected to handheld computers with a science and math focus. Thomas Register is a company provides a very comprehensive catalog of manufacturing products. Though you must have a user name and password to use their catalog, you can get one for free by filling out their registration form. Once at their home search page, search for the word sensor to retrieve hundreds of types of sensors and contact information for the companies that sell them. More importantly it provides a database of companies that also sell all the other parts that a sensor design might need. If you would like for someone with electronics background to wire a sensor to your classroom computer, ask for such a person through your school newsletter and generally a parent with electronics background will take an interest in your project.
The Electronic Industries Foundation is another useful resource. They track and report on funding sources for curriculum work in this area and from time to time are a funding source themselves. The foundation is the not-for-profit sector of the Electronic Industries Alliance (EIA), the philanthropic arm for this federation of 5 associations comprising over 2,100 U.S. electronics, telecommunications and hi-tech companies.
Sensors are devices which can record subject specific data. There is an immense array of sensors that can be hooked to computers and other devices. These sensors might report the number of people who pass through a turnstile at the movies or be used by a bar code reader at the grocery store to indicate that the last can of tuna has been purchased and it is time to restock the shelves. When sensors are dropped in streams, they might report the level of water, its speed, temperature, water clarity, or the presence and percentage of disease causing bacteria such as coliform. The Hubble Space telescope is in essence an optical sensor controlled by earth-based computers. A design must begin what a decision about what one wants the sensor to sense, and other decisions about how the device should respond once something is sensed.
Having a wide understanding of what sensors can do puts a composer in a position of having an idea that someone else will assemble. This does indicate the opportunity for software development and grant proposals to develop such. There have been some simulation programs that explore the general process in a game like fashion, but such programs have not had staying power in the market. There are also a variety of project kits for all kinds of sensor and robotic projects, but these generally could not be completed in the time of one evening course, say 3 hours. Such kits also presume a number of electrical and electronic skills not possessed by most students and educators. The shortest route to the creation of such a system for an educator is to partner with someone. The partner might be a high school electronic course or higher education programs training electronic and electrical engineers. Sometimes composition ideas are within range of course projects for students.
Fortunately, there are ways to compose significant sensor designs without the soldering iron and wires. There are several robotics kits that have simplified the connecting process and represent the future of electronic design for the everyday user of digital devices. Reporting their results to the Web though still requires manually taking pictures or other forms of recording results by hand that can be input to Web pages, a process that developments in the field would indicate will soon change. The commercial leader in this area has been the Lego Company.
That said, there are curriculum materials that introduce electronics and the use of sensors for minimal expense using household and common electronic store products. One of these sources is a book of ideas and things to try. For more, explore Circuit Sense in Brief. This extended set of web pages introduces the book, shows pictures of elements of electronic compositions such as circuits, sensors, switches and more and provides pictures of some completed projects. Ideas from this work can be used with learners of all ages, and many of these activities work well is helping primary level students develop their own electronic designs.
The sensor data might be displayed in web compositions as one frame of a web page, an inline frame or a pop-up page. But the overall technique is not as important as having a style guide to its integration. Earlier in this online textbook, the National Geographic strategic was discussed for integrating text and images. Recall that their articles begin with very large images and limited text and then scale down images and scale up text over the length of an article. What strategy would appear to be most useful for integration sensors into a composition?
The scaling down strategy works well for images. An image can provide a a quick overview of the whole and set the theme or direction of a composition. Such a strategy could be used for sensor integration. That is, the beginning of a composition might show a stream or table of data or graph from a sensor and a related article that explains what the graph or data set means.
Because such presentation of sensor data is often not as self-explanatory as a photograph, there is another integration strategy for sensors that makes sense and that also has a traditional role in text publishing, as evidence in support of a point. That is the sensor data might be integrated as a kind of citation that would indicate the presence of sensor data, the nature of the data and the date on which the author noted that this system was functioning. That is, if one is discussing the beauty of a harbor scene in Australia, a live web cam view (light and optical sensors) across the harbor of the opera house in Sydney (live sensor, Sydney opera house web cam, November 17, 2003) would be used. If one was preparing a report on the regular periodic fluctuations of a local stream, one would reference the Geological Survey data coming from that stream (live sensor, Tuckaseigee water depth, November 17, 2003).
A similar example is the Greenville Bridge Site Story. In this two frame composition, the top frame leads to webcam shots of the construction area and other related curriculum materials. The bottom frame provides live web data of the current water level and leads to the presentation of other information as well.
Larger compositions will be created from a larger collection of images. For example, a three-dimensional graph might be created from current data with the click of a mouse that would activate a current collection of the information from multiple sensors. Though I have no example, such reference would require another special type of citation that could be done with the standard scripting language with Microsoft Excel or other scripting languages (example: live sensor collection, Kansas weather map, November 17, 2003). This would require some programming skills with a web focused language like PERL or PHP.
The above Output section of this page provides numerous examples of web sites reporting currently data an intervals of live to hours to days. These sources make excellent elements for creating your own web page compositions that integrate sensor data. For those interested in the challenge of making their own sensor projects that report to the web, refer to resources listed in the Manipulation section above.
The scale-down and the evidence reference strategy are just two possible approaches for integration of sensor information. Sensor information has also been used as components of larger compositions. For example, audio or musical sounds have been created using live sensor data, from simulation wind chime sounds to coordinate values that guide the movement, pressure and colors of a pen that draws images.
A weather based example could provide a model for a uni-media composition. Text information would supplement the various media elements. A map with hotspots would guide the viewer to different perspectives. An animation of satellite photos would show weather movements over the last several hours. Still images taken from live web cams would be arranged in a table to show past and current weather conditions. A series of two or three dimensional map from a GIS program would show where the weather might impact various structures or events across a region. A musical wind chimes might use real data that plays softly in light winds and add more and louder chime sounds as the wind speed increases. Video and audio files could play TV news channel weather reports from an archive or be provided live as they occur. A three dimensional graph based on live weather data might further enhance the information story and would require some further text explanation for those not familiar with its representations.
Though the Web is an important form of digital publication for sensor related activity, one must not overlook that ultimate form electronic composition, robotics. Incoming Web sensor data might also be used to guide the activity and work of a robot or robotic devices, whether for aesthetic or work activity. Sensor designs, together with the rest of the digital palette, further open the door to the dawn of a new age, an age of imagineering.
Visit the eCROP blog site to comment on this article on Sensors & Remote Control Composition.
Bibliographies: Still - Audio - Video - 2D - 3D - Sensor - interact - MM
Leadership Experts
Goeff Mulligan, Chair, IPSO, Proto6 LLC. 719.593.2992, incorporated 3 companies in 2007: Mulligan Labs LLC; Proto6 LLC; SF Bay Packet Radio at 2175 Cloverdale Drive, Colorado Springs, CO. ZoomInfo profile.
Publications
Sensor Magazine, a trade magazine for scientists and engineers about sensors.
Sensors
and Actuators B: Chemical, An international journal devoted to research
and development of chemical
transducers
Bashshur R, Lovett J. (1977, January). Assessment of telemedicine: Results of the initial experience. Aviation Space and Environmental Medicine, 48(1), 65-70.
Chamberlin, Sean (2003). The remarkable ocean world: The Gaia hypothesis. Intelligent Communications. Retrieved November 10, 2003 from http://www.oceansonline.com/gaiaho.htm
Gartner, (2009). Gartner Predicts 2009 Briefing, Sydney, Australia, retrieved February 7, 2009 from http://www.gartner.com/it/page.jsp?id=876512
Gruber, B. (2009, August 11). Wi-Fi pacemaker in U.S. gives patient freedom. Reuters. Retrieved August 11, 2009 from http://www.reuters.com/article/technologyNews/idUSTRE5790AK20090811?pageNumber=1&virtualBrandChannel=0
Ho, Vanessa (2008, September 18). New industry alliance launched to promote use of IP in networks of smart objects. Daily Channel News. Retrieved July 20, 2009 from http://www.echannelline.com/usa/story.cfm?item=23722.
Hardy, Quentin (September 1, 2003). Sensing Opportunity, Forbes.com, Retrieved November 17, 2003 from http://www.forbes.com/free_forbes/2003/0901/107.html
I-cube-X http://infusionsystems.com
Saffo, Paul (April 15, 2002). Smart Sensors Focus on the Future, CIO: Insight. Retrieved November 9, 2003 from http://www.cioinsight.com/article2/0,3959,2132,00.asp
Smith, Sharon & Nagel, David (November, 2003). Nanotechnology-Enabled Sensors: Possibilities, Realities, and Applications Sensors Online Magazine, Retrieved November 17, 2003 from http://www.sensorsmag.com/articles/1103/22/.
Preuss, Paul (February 21, 2001). CO2 sensors: Climate Change Scenarios Compel Studies of Ocean Carbon Storage. Berkeley Lab. Retrieved July 2, 2003 from http://www.lbl.gov/Science-Articles/Archive/sea-carb-bish.html
Preuss, Paul (April 15, 2004). Robotic Floats Shed New Light on the Iron Hypothesis. Retrieved February 18, 2007 from http://www.lbl.gov/Science-Articles/Archive/ESD-SOFeX.html
To cite this page:
Houghton R.S. (2011). Chapter Seven: Sensors and Electronic Remote Control. In Multimedia Education. Retrieved (current date here) from http://www.wcu.edu/ceap/houghton/MM/Ch7/Ch7mmframes.html