This Web page is designed for teachers to think about Web resources and how to integrate them into a larger composition for instructional activity. The Hwy 82 Greenville Bridge project is used as an example of a comprehensive multimedia project that integrates the full digital literacy palette in the context of the current chapter on Sensors. With this chapter, this online textbook has provided an introduction to all of the elements of the digital palette. This page reviews the different types of media that can be found for such a composition, highlighting sensor information.
Different agencies and organizations provide different kinds of sensor data. By using frame pages, data from different sources related to the same topic can be combined in a wide variety of ways for educational use.
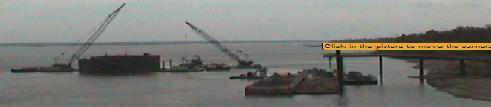
The picture above was captured from the Webcam that once ran 24/7 while this bridge was being constructed over the Mississippi River. In the double frame barge lock and water level gauge example to the right, the top frame is an example of a barge traffic lock webcam for a point above the bridge. The bottom frame on the right is from the data from sensor station maintained by USGS (United States Geological Survey) near Greenville, MS. This sensor station is just one of the 1.5 million USGS sensor stations located across the streams and waterways of the United States and Puerto Rico. By putting the screen cursor on the dividing line between them, a click/drag allows one window to be made much larger than the other. Fully scroll both the upper and lower frame to see the full view of what is available.
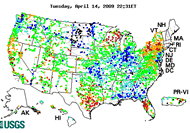 The map on the right graphing real time stream sensor data is from the National Water Information System site which maintains a click and zoom in of state maps that leads to individual sensor data (click map on the right). There is a also a mashup interactive map, the National Water Information System Mapper, that integrates sensor location as a layer on top of an array of maps from Google. There are many places at which Mississippi River streamflow is measured that could be included to extend the thinking that starts around this bridge. These frame could also be integrated separately: barge lock webcam; water gauge near Greenville, MS.
USGS's pages also provide the sensor location at Latitude 33°17'33", Longitude 91°09'38" of the Greenville, MS sensor station, data which can be copied and pasted into the Search Box in Google Earth (GE).This location data must be modified for GE to work with it by removing the words and adding two letters, so that it becomes 33°17'33"N, 91°09'38"W before clicking the search button. A GE placemark for the sensor at this location shows that the gauge must be located at the base of one of the bridge towers of the old bridge near the middle of the river.
The YouTube videoclip belows provides one idea as to why the old bridge had become a problem. At the same time it provides an eye level view of the top of the new bridge under construction a short distance downstream from the biker's location.
Work on the remaining aspects of the new bridge will probably finish in late 2009 or 2010.
As the construction continued, educational materials began to build on a Web site that became the Greenville Bridge Web site, a fine multimedia composition in its own right that provides Flash animation, images, audio and video. How many of the media of the digital palette can be found at this site? Curiously, some sources of readily available data about this location were never included at the Green Bidge Web site. What are they? See the next paragraphs for some of the answer to this question.
For a more aerial perspective on the Greenville Bridge, start up Google Earth and then click the Greenville Bridge placemark to visit and explore this location further. Once the view in Google Earth is positioned around 2,000 to 3,000 feet over the top of the bridge area, click the clock symbol at the top of the window and a timeline of prior satellite photos appears going back to 1996. Use the sliders to move thru the different views to see change over time from 1996 forward. What activities does this time slider enable enable? Can anything be can be done here with the Google Earth measurement tool that fits classroom curriculum needs? What further analysis can be made of the area and region around this bridge by turning on and off of various features of the Layers section of Google Earth?
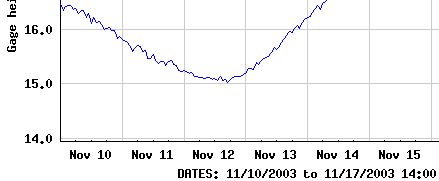
The image below of part of the graph was taken from the USGS site.
What other media elements and ideas of the digital palette that are missing and could have been included? Is there anything that prevents a new author from integrating the existing work with missing elements? How would you do that?
One solution to the how questions is to use this course Greenville Bridge Curricululm wiki site built with Google Sites to build out pages that invent instructional curriculum activities enabled by this composition by content and grade level. I need an email address for you to make you a collaborator, a full editor of the pages at this site.
What would have to be done to make it possible for this same left frame to hold both this current teacher information page, and a student curriculum activities page from Google Sites? How might this site be used to create engagement and composition by the audience?
Future links at the wiki site to pages that would appear in the left frame:
Each of these pages would have links at the bottom that put the Media page, the Teacher page and the Student page in the left column. Each of these pages would have links that would popover the existing frameset or would insert into the right frame appropriate to nature of the reader. Once you have been elevated to collaborator, feel free to create an example at the site of a Teacher Page or Student Page for your content area or grade level. Be prepared to create such in the next class session. This leaves design and composition decisions for an author to make. Should such Web pages be ones at the primary Web site that only the author can edit, or in a publically editable space where team members could assist and enhance?
Your challenge is to see how this emerging model of the Greenville Bridge Multimedia Composition helps you with the organization and instructional use and growth of your own Web site compositions, making one project useful for different types of viewers.
This work is part of the parent chapter on Sensors: http://www.wcu.edu/ceap/houghton/MM/Ch7/Ch7mmframes.html
Version 1.12 Updated July 25, 2009 | Page author: Houghton